C&E Matrix Overview
The team develops an understanding of the greatest sources of variation within the process and pinpoints the critical few key process input variables that must be addressed to improve the key process output variables.
C&E Matrix
- What
- A Cause and Effect Matrix relates process steps to inputs and correlates to process outputs.
- Customer requirements are ranked by order of importance and then inputs and outputs are rated by their interaction impact.
- It relates the key inputs to the key outputs (customer requirements) using the process map as the primary source.
- What
- A cause and effect matrix relates process steps to inputs and correlates to process outputs.
- Customer requirements are ranked by order of importance and then inputs and outputs are rated by their interaction impact.
- It relates the key inputs to the key outputs (customer requirements) using the process map as the primary source.
- How
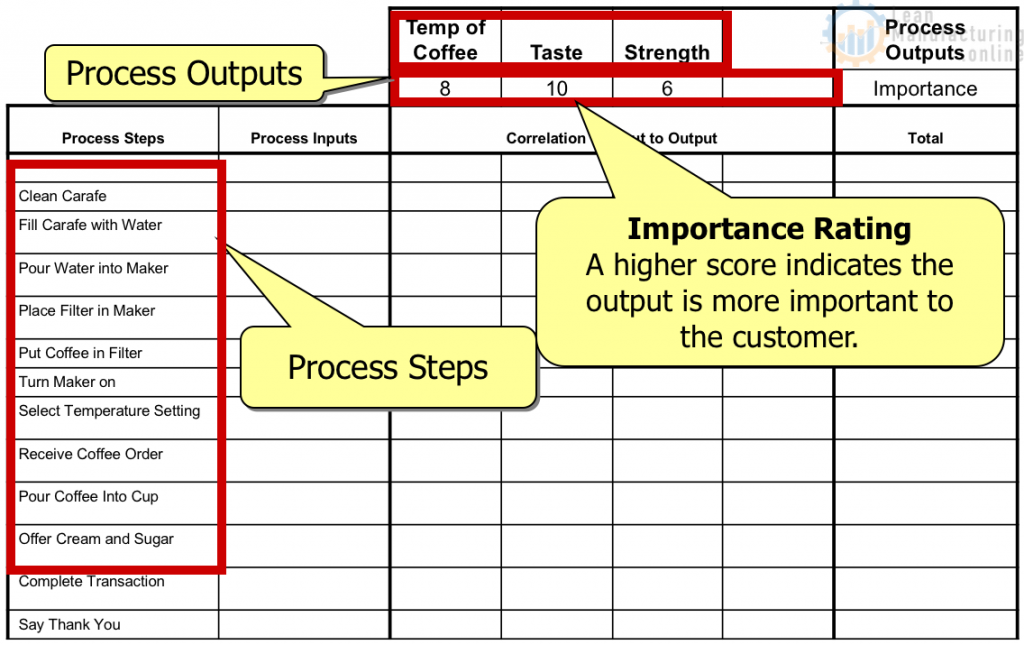
- Identify key customer requirements (outputs) from the process map.
- Outputs are given a priority score according to importance to the customer (usually on a 1 to 10 scale, with 10 being most important).
- Identify all process steps and materials (inputs) from the process map.
- Inputs are rated based on the strength of their relationship with output variables and given a correlation score as follows:
- 0 = no correlation
- 1 = remote correlation
- 3 = moderate correlation
- 9 = strong correlation
- Create a Pareto chart and focus on the variables with the highest scores.
- Cross multiply correlation scores with priority scores and add across for each input.
- Create a Pareto chart and focus on the variables with the highest scores.
C&E Matrix Form
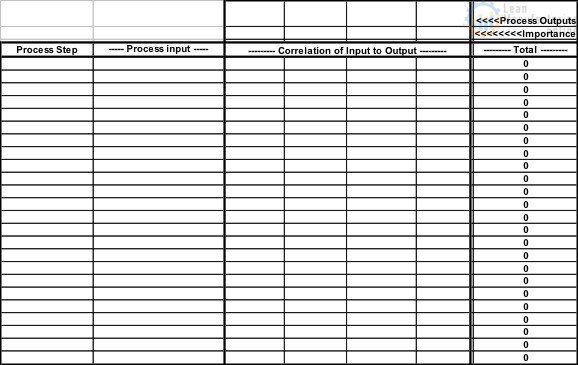
Steps
- Step 1
- Place the outputs across the top of the matrix and rank.
- Place the process steps down the side of the matrix.
- Correlate process step to outputs.
- Pareto the process steps.
- Step 2
- Start a new C&E matrix with the inputs from the top three or four process steps.
Truck Stop Example: Serving Coffee at a Truck Stop
- A Black Belt at a local truck stop wants to improve customer satisfaction with the coffee they serve.
- The team has completed a value stream map and they are ready to create a C&E matrix to identify the inputs that have the largest impact on customer satisfaction.

- We will use the focused approach to help us narrow our efforts to the process steps having the most impact on customer satisfaction.
- We will limit this example to 3 key outputs. However, we could also look at other aspects of customer satisfaction.
- We could consider the speed of service, friendliness, accuracy, etc.

- The Pareto chart shows us that 4 process steps have the most impact on our process outputs:
- Fill the carafe with water
- Put coffee in the filter
- Offer cream and sugar
- Select temperature setting
- We would follow this up by using the C&E matrix and the process inputs from these 4 process steps.
- High-ranked process inputs may be evaluated with FMEA.


4M Analysis Process
The purpose of this procedure is to define the steps to do a 4M …


