What are Loss Trees?
In general, Loss Trees are simply a listing of the losses (inefficiencies) which may exist in a factory production process. Loss Deployment is a cascade process that looks initially at the overall factory losses than increasingly at a more detailed level down to a packing line or a single machine item.
Traditionally the initial TPM approach is to consider the 6-8 Equipment Losses.
With the addition of more loss categories, such as Management Losses the total number of losses can potentially increase to 20 or more.
These can be divided into 4 subgroups:
- Six major losses that reduce equipment effectiveness (see below)
- Losses that can impede machine reliability (Shut down losses e.g. planned stops)
- Man Losses – Four major losses that impede man’s efficiency
- Management losses, (Lack of instructions/awaiting materials or Training/meetings);
- Operating Motion (Incorrect or missing procedures);
- Line organization (layout, ergonomics), Logistics (Poor efficiency materials supply, etc)
- Measurement & adjustment (quality monitoring losses)
- Three Losses that can impede the effective use of production resources
- Yield, Energy, and Die-Jig losses
Six Major Losses
Loss Trees
One way of representing these major losses which give a good overview of a factory performance is in a bar chart format as shown below. The losses may be represented as time, percentages, or preferably as capacity (e.g. Tonnes) loss:
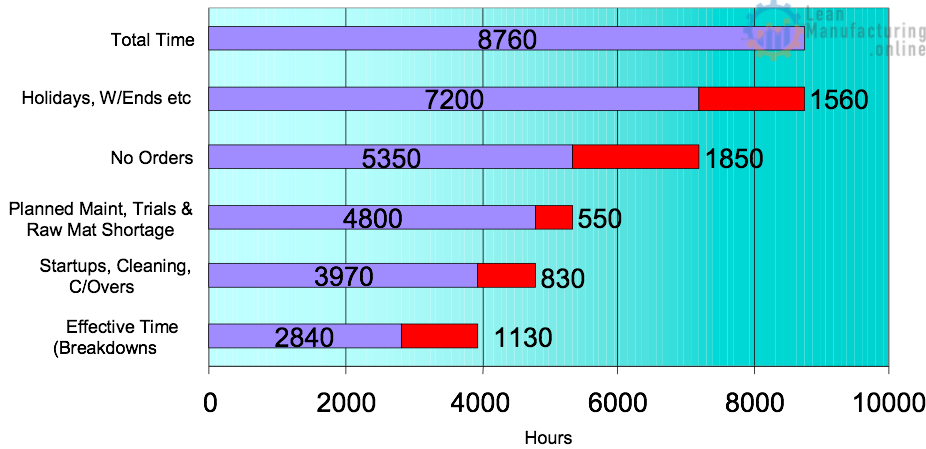
The Loss Trees for the Manufacturing (Make) process can be extended to include the Supply Chain, materials (Source), and service (Delivery). More losses can be added in addition to the above 6 major losses:
- Material Failure (Time Lost as a result of material quality failure),
- No demand plan (Time lost due to no orders etc),
- Trails & Testing (Time lost for setting up and running trials),
- Plan Loss (Due to error in material/production planning),
- Source (Time lost waiting for delivery of materials),
- Delivery Loss (Waiting for finished stock to be transported to Customer),
- Yield – Mass Balance (Total material variability from zero baselines),
- Give-away (Product lost through weight control or Waste disposal),
- Service Energy Loss (Cost of Water/steam/electricity wastage),
- Indirect (Cost of support including people, materials, TPM support, etc).
The preferred way of arranging and reporting these losses or their equivalent KPIs is via the
P Q C D S M I Structure:
- Productivity (eg. OE/equipment losses),
- Quality (eg. Rework/Defects),
- Cost (eg. Raw Material waste),
- Delivery (eg. Logistics losses),
- Safety (eg. Accidents Time loss),
- Morale (eg. TPM & other training),
- Innovation (eg. non-vertical start-up).
When to use Loss Deployment?
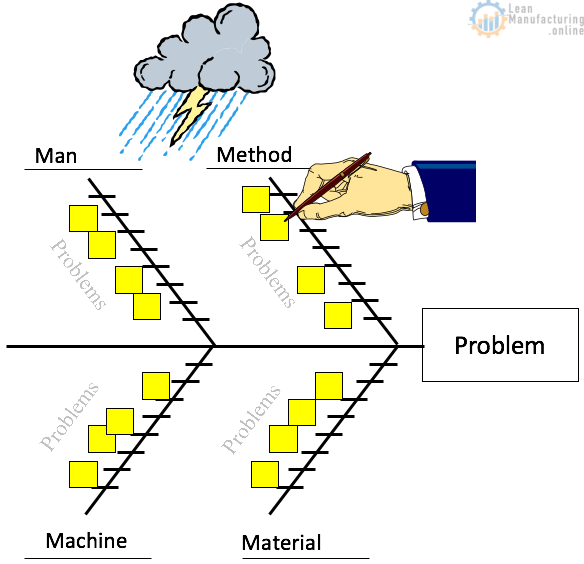
Loss deployment in particular the six main losses are a cornerstone within the TPM culture and are applied to give an understanding of equipment operational inefficiencies and the hence priorities for focussed improvement activities which use problem-solving tools such as the Ishikawa (4Ms) diagram to reduce losses.
The six big losses should be an integral part of the Factory Performance Benchmarking Process. The sixteen major losses are used in the wider calculation of Overall Equipment Effectiveness (OEE).
As part of the continuous improvement of the Benchmarking Process, loss-based K.P.I.s should be increasingly used. A core set of K.P.I.s and the corresponding Loss Tree will form part of the common measures needed for the successful implementation and operation of your site.


4M Analysis Process
The purpose of this procedure is to define the steps to do a 4M …


