Plant reliability is the key underpinning of an efficient supply chain. Without the ability to produce what is needed, when it is needed and, in the quantity needed, the entire Supply Chain must cover itself by placing inventory at critical areas thus driving up working capital and total costs. Excessive inventory is a sure sign of internal problems in any manufacturing operation.
It is this relationship between breakdowns, reliability, excess inventory and customer service levels that increases the total cost of a production line breakdown to well above just the cost lost labor, mechanic’s salary and cost of spare parts.
Some Industry Consultants estimate that as much as 50% of a company’s FG inventory is driven by uncertainty which is in part driven by low reliability of the manufacturing plants. If we assume that only 15% of the uncertainty is driven by production line breakdowns then this equals huge opportunity above and beyond the cost of direct losses generated by a breakdown.
As you can see, there is significant business benefits to reducing the losses and uncertainty associated with production line breakdowns. The ability to proactively identify and eliminate breakdowns through the 4 phase approach (Reduce frequency, Extend life, Time Based Maintenance, and Predictive Maintenance) are the underlying approach to achieve Zero breakdowns within the PM Pillar of TPM.
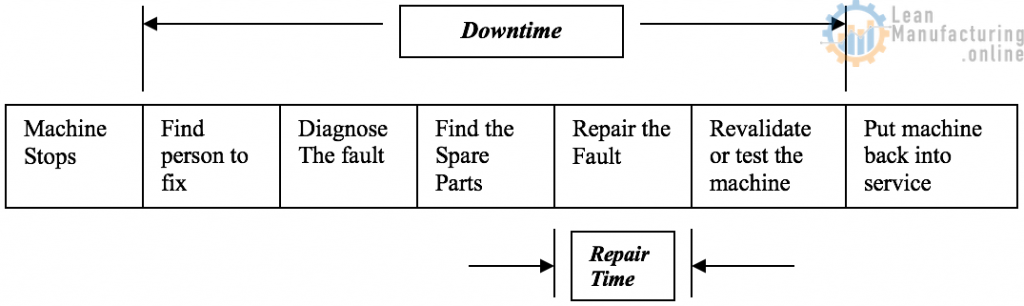
We will focus on (Phase 1 – Reduce frequency). In this phase accurate data is a prerequisite to the analysis process. Historical breakdown data from a CMMS system and a downtime data collection system are critical to insure resources are applied against to greatest opportunities (largest losses). Breakdowns can be quantified in many ways such as: frequency of occurrence; total duration; cost to fix (spares and labor); lost production labor costs; etc. It is important to note that the time to repair noted in a CMMS system captured by the work order process, may be only part of the total downtime caused by a breakdown. This is illustrated as follows:
It is important to understand the total impact of your plant’s breakdowns to insure correct priorities are selected to focus resources against. The major stop information should feed into your plant’s loss tree. After your plant has identified the largest losses attributed to major stops, then a small team can be assigned responsibility to resolve using the data, and the tools of TPM (CAPDO, 5-Why, 5W-1H, Fishbone diagram, Etc.)
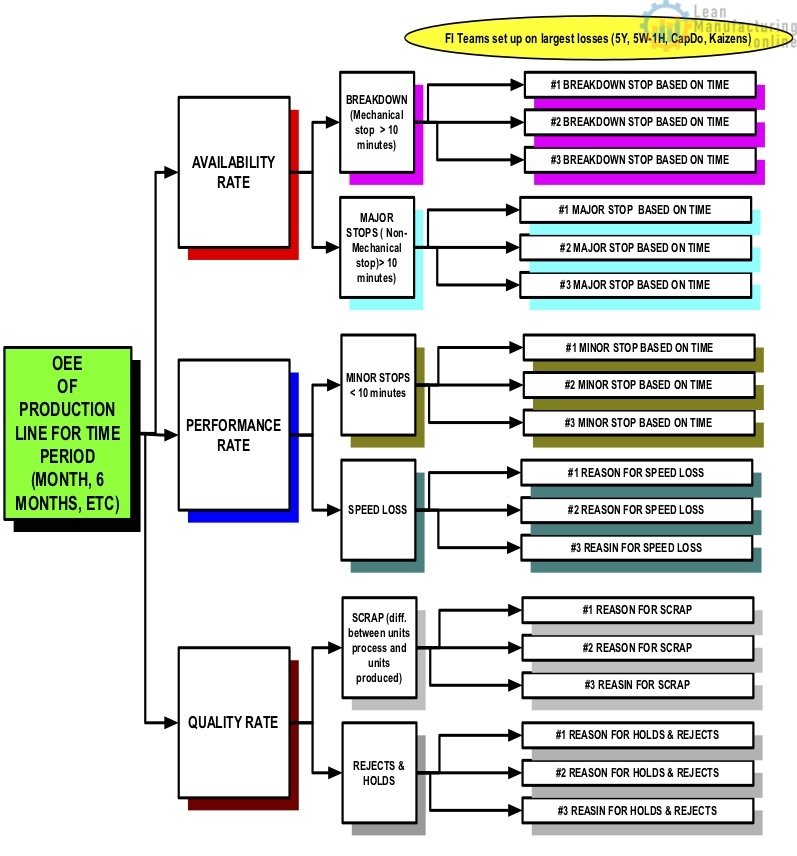
Within TPM major stops are defined as any stop in production with duration of more than 10 minutes. As you can see from the loss tree, major stops can be stratified further into mechanical or breakdown and non-mechanical. The non-mechanical stops can be caused by the same reasons as minor stops but are more severe and take longer to resolve. A Major stop can be caused by many factors such as improper adjustments on the production line; out-of-spec packaging materials; operator skill level; poor production line design; just to name a few.
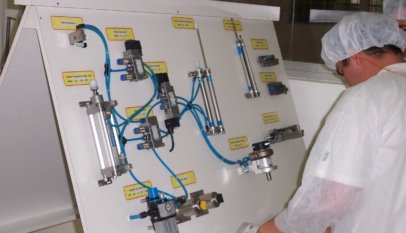
Major stops caused by mechanical failure are a focus of the PM pillar and employee the collective input from both operators and mechanics to resolve. In these situations, it is critical to have accurate data. Also, it can be very helpful to have examples of broken parts from previous failures to examine. This can help identify the root cause as your small team goes through a 5W-1H and a 5-Why analysis.
Not all breakdowns are created equal. A breakdown of a forklift truck that takes 3 hours to fix may not cause any loss of production since most plants have numerous forklift trucks. However, a similar length breakdown on an air compressor could bring an entire production line to a halt. It is important for each plant to identify a list of critical assets. A critical asset is one minute of downtime will result in one minute of loss production. Anther way to look at critical assets is to look at its impact. A mechanical failure on some assets will result in loss production on one line; other assets will cause the entire plant to shut down while still other assets will not result in any loss production time. It is important for a plant to know which are its most critical assets and to ensure that both downtime data and CMMS data are available to evaluate if they become the reason for significant lost production time.
In Food Packaging business, filler should be considered as the most critical asset on a packaging line. If the filler isn’t running, we are not making money. This is why we should measure OEE at the filler on all production lines and breakdown analyses should focus on filler’s downtime, which would lead to improvements.
Improvement can help to eliminate losses from food packaging plants. Each one of these improvements may be difficult to measure the benefit on their own merit. However, over time, in aggregate, these improvements can have a significant impact on your plant’s over all performance. As we noted earlier, this improvement can also have a positive impact in other areas of the supply chain. The bottom line is that eliminating losses, such as breakdowns, from our plants will result in a more productive, efficient, safe and reliable production environment. These are characteristics of a profitable operation and generate job security for all.


4M Analysis Process
The purpose of this procedure is to define the steps to do a 4M …


