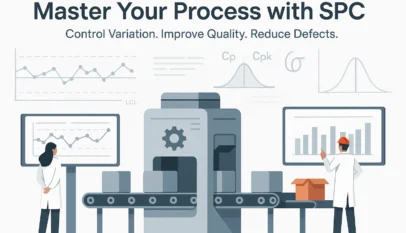
📊 Statistical Process Control (SPC) Framework
SPC is a powerful method used to monitor, control, and improve processes using statistical analysis.
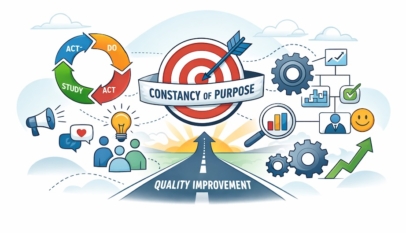
Key principle: If you measure it, you can improve it.
🔄 Process Boundaries: SIPOC Model
Suppliers ➡ Inputs ➡ Process ➡ Outputs ➡ Customers
Inputs
- 👥 People Management
- 📋 Methods (SOPs)
- 📐 Specifications
- 📂 QMS Documents
- 🌿 Environment
Process
Central transformation stage where SPC is applied.
Outputs
- 📦 Products
- 🛠️ Services
- 📝 Reports
- 🔁 Change Management
- 📞 Support Management
Feedback Loops
- 🔁 Voice of the Customer: Drives improvement based on customer needs.
- 🔁 Voice of the Process (SPC): Data-driven insight to monitor stability and capability.
📥 Data Collection Example
Weekly Data Collection Sheet
| Time | Day 1 | Day 2 | Day 3 | Day 4 | Day 5 | Total | Avg |
|---|---|---|---|---|---|---|---|
| 8:00 AM | 0.25 | 0.25 | 0.27 | 0.25 | 0.31 | 1.33 | 0.266 |
| 10:00 AM | 0.38 | 0.30 | 0.34 | 0.32 | 0.28 | 1.62 | 0.324 |
| 12:00 PM | 0.28 | 0.28 | 0.27 | 0.30 | 0.30 | 1.43 | 0.284 |
| 2:00 PM | 0.30 | 0.28 | 0.27 | 0.32 | 0.28 | 1.45 | 0.290 |
| 4:00 PM | 0.26 | 0.27 | 0.28 | 0.32 | 0.32 | 1.42 | 0.284 |
| Total | 7.31 | 1.462 | |||||
📈 Control Charts & Limits
Control Limits (±3σ from the mean)
- UCL: Upper Control Limit
- LCL: Lower Control Limit
- Center Line: Mean of process data
🔍 In a stable process, ~99.73% of data points fall within these limits.
🧪 Process Control Methods
- 🔒 Mistake Proofing (Poka-Yoke)
- 📄 100% Inspection (used in high-risk scenarios)
- 📊 Statistical Process Control (preferred method)
📏 Process Capability
Formulas
- Cp = (USL − LSL) / 6σ
- Cpk = min[(USL − μ) / 3σ, (μ − LSL) / 3σ]
Interpretation
- ✅ Cpk = 1 → Meets specs, but barely
- ❌ Cpk < 1 → Not capable (produces defects)
- 🚀 Cpk > 1 → Capable process (stable, low defects)
🔍 Cp measures spread only.
Cpk measures both spread and centering relative to spec limits.
✅ Final Notes
- SPC captures the Voice of the Process and empowers data-driven decisions.
- Use SPC with Lean and Six Sigma to build sustainable, defect-free operations.
- Remember: Control before Capability.


4M Analysis Process
The purpose of this procedure is to define the steps to do a 4M …


