Exploring the World of Statistical Software for Data Analysis
When it comes to statistical analysis and visualization, most professionals think of Minitab first. It’s powerful, full-featured, and trusted across industries. However, the cost—often $ 1,500 per year or more—leads many to explore alternatives that strike a balance between affordability, usability, and flexibility.
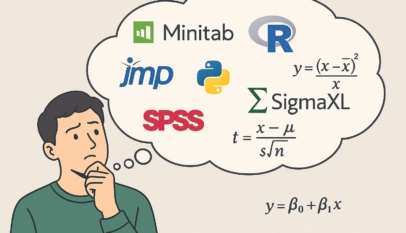
Below, we’ll explore how seven major platforms—Minitab, JMP, SigmaMagic, SigmaXL, SPSS, Statgraphics, R with RStudio, and Python with SciPy/Statsmodels—stack up across price, features, and customization.
1. Cost and Platform
- Minitab: Desktop-based, ~$1500/year.
- JMP: Desktop-based, ~$1000/year.
- SigmaMagic: Excel add-in, ~$199/year.
- SigmaXL: Excel add-in, ~$300 one-time.
- SPSS: Desktop, $99–$1300/year depending on license.
- Statgraphics: Desktop, ~$995 one-time.
- R (with RStudio): Open source, free.
- Python (SciPy, Statsmodels): Open source, free.
Right away, you can see a spectrum: Minitab and JMP are premium, while R and Python offer complete freedom at no cost—but require more learning.
2. Core Statistical Tools
Every software covers hypothesis testing, regression, and ANOVA. But differences emerge with Design of Experiments (DOE) and related methods:
- Minitab: Full suite—fractional, full, response surface, Taguchi, and mixture designs.
- JMP: Very strong DOE capabilities.
- SigmaMagic: Full suite built into Excel.
- SigmaXL: Only basic DOE support.
- SPSS: Limited DOE unless plugins are added.
- Statgraphics: Good DOE support, though not as extensive as Minitab/JMP.
- R: Powerful DOE through packages like
qccandrsm. - Python: DOE limited; advanced designs need custom coding.
If DOE is critical, Minitab, JMP, or SigmaMagic are the go-to choices.
3. Control Charts and Process Tools
SPC (Statistical Process Control) and control charts are vital in manufacturing and quality management.
- Minitab, JMP, SigmaMagic, SigmaXL, Statgraphics, R (via packages) handle them well.
- SPSS relies on plugins.
- Python requires manual or partial coding approaches.
Advanced tools like EWMA and CUSUM charts are consistently strong in Minitab, JMP, and R.
For Gage R&R / MSA, Minitab, JMP, SigmaMagic, and SigmaXL stand out, while SPSS and Python require manual effort or lack coverage.
4. Specialized Capabilities
- Process Capability Analysis: Supported by most, but limited in SPSS and manual in Python.
- Normality Tests: Standard across all, though again more manual in Python.
- Control Plans & FMEA: Structured in Minitab and SigmaMagic, partial in SigmaXL, add-on based in JMP, and manual in Python.
- DMAIC Project Templates: Built into Minitab and SigmaMagic, structured in SigmaXL, partial in JMP, absent in SPSS/Statgraphics/Python.
5. Ease of Use, Support, and Customization
- Ease of Use: Highest ratings for SigmaMagic, SigmaXL, SPSS, and Statgraphics (Excel add-ins or familiar interfaces). R and Python are powerful but come with steeper learning curves.
- Documentation & Support: Minitab, JMP, SPSS, and Statgraphics excel here. R and Python rely on community-driven resources.
- Customizability: R and Python provide full control for advanced users. Commercial software often limits customization to ensure simplicity.
6. Recommendations by User Type
- On a budget (Six Sigma Black Belt): SigmaMagic offers strong DOE, SPC, and templates at a fraction of Minitab’s cost.
- Green Belt or Instructor: SigmaXL strikes a balance between affordability and structured templates.
- Advanced DOE Needs: Stick with Minitab, JMP, or SigmaMagic.
- Mixed Statistics + Business Analytics: SPSS is popular outside manufacturing, particularly in social sciences.
- Full Flexibility (Free): R with RStudio unlocks limitless potential with packages, ideal for those who can invest time in learning.
- Engineer with Coding Skills: Python is a great long-term tool, though DOE remains its weak spot.
TL;DR
There’s no one-size-fits-all solution in statistical software. The choice depends on whether you value affordability, flexibility, or ease of use.
- If you need structured, ready-to-use tools: Minitab, JMP, or SigmaMagic.
- If you prefer low cost and Excel familiarity: SigmaXL or SigmaMagic.
- If you want customization and coding freedom: R and Python win hands down.
By weighing these trade-offs, you’ll find the right tool to support your statistical analysis journey—without overspending or underpowering your work.


4M Analysis Process
The purpose of this procedure is to define the steps to do a 4M …


