Procedure for analysis of potential failure modes within a system for classification by severity or determination of the effect of failures on the system.
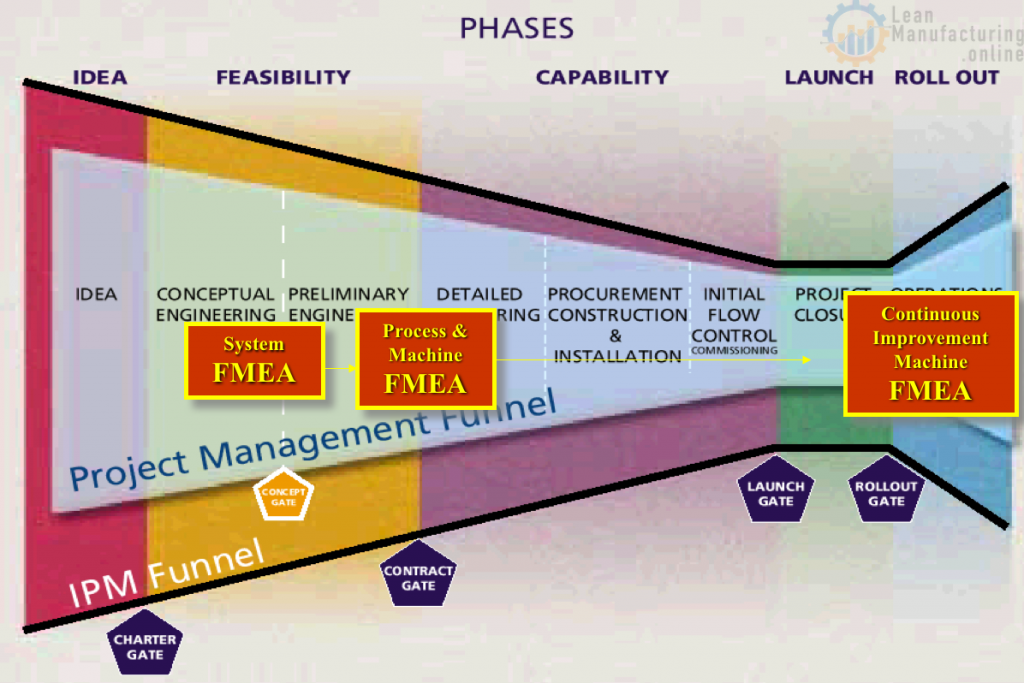
Types of FMEA

FMEA + other tools & Techniques

FMEA template

Process Description
System, Part No., Operation No.
Process Purpose
What has to be achieved, specification, targets or requirements.
Potential Failure Mode
How it fails to meet the objectives identified in the function, plus any typical failures associated with such.
Potential Effects of Failure
The effects of failure has on the end user, the next customer and in terms of scrap, rework and downtime, plus health and safety issues.
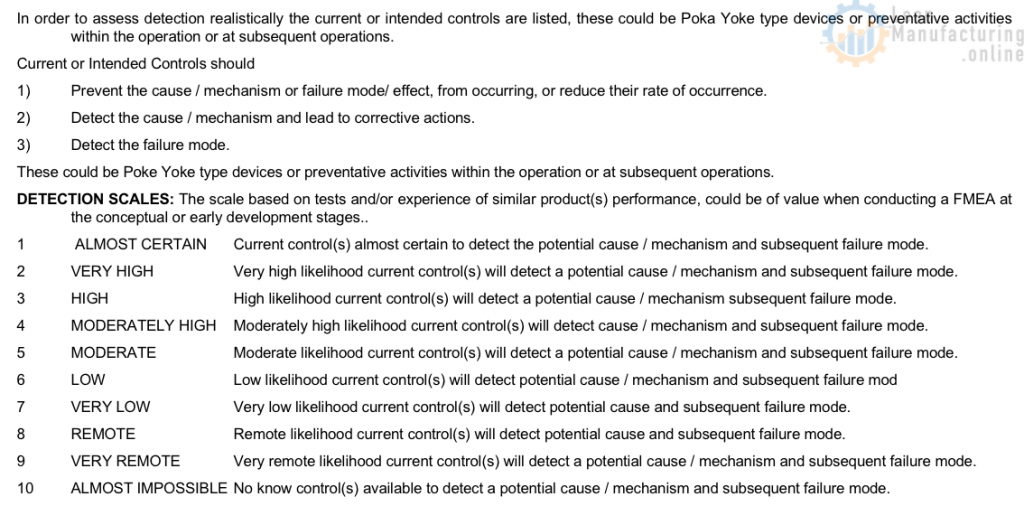
- Severity: assign a number between 1 and 10 on the seriousness of the Effect. The higher the number the worse the effect.
Potential Causes of Failure
What can cause the Failure Mode to occur. Examples: incorrect setting, equipment failure, influence of the environment etc.
- Occurrence: decide a number between 1 and 10 on the likelihood of the cause happening.
Current controls
The current or intended controls that will detect either the cause or failure mode. Examples: testing, poka yoke devices, inspections.
- Detection: the chances of the controls detecting the defect before it leaves the plant are addressed on to scale 1 to 10. (1 is almost certain to detect)
- Risk Priority Number (RPN). RPN = S x O x D. There is a number of criteria for selecting which causes to work on:
- Causes with highest RPN numbers (say top 10%)
- Severity of 10 with occurrences over 2
- High occurrence, if not included in the other criteria should be acted upon.
Recommended actions
Actions to be taken include problem solving techniques, monitoring, TPM tools, data collections and analysis. Against causes that no action is to be taken, enter “NONE”.
Responsibility and target completion date
Identify who is responsible and enter a target completion date to which they have agreed / acknowledged.
Action taken
Describes changes made
- Severity: can only be changed if a design modification has been introduced that will overcome the Effect of failure mode.
- Occurrence and Detection: the likelihood of Occurrence can be reduced or the chances of Detection improved. Either of which will reduce the RPN
- RPN: the new RPN should be less than the previous, if not review action.
FMEA Examples
– Organization
– Process FMEA sheet
– Risk Priority Tables
Organizing an FMEA
Keep the team reasonability small and try to have an odd number.
Co-opt experts if required.
1.Limit the number of team members to 3 or 5.
2.It can only be as good as the team, select team on the basis of; knowledge, experience, expertise.
3.Keep each session to 1 or 2 hours max.
4.Decide on a strategy for tackling the subject, break it down into function or process steps.
5.Develop a target time table for completion and regularly review progress, do not leave open ended.
6.Do not commit the finished typing too early.
7.Remember it is a live document update as and when necessary.
8.Co-opt specialist if and when required.
Process FMEA sheet
The System FMEA is looking at the inter-relationship between the proposed sub-systems.

Criteria for preventive / corrective action
The RPN numbers would vary one team to another and are therefore only relative, the ranking scale aids should minimize the variation between teams but it must be acknowledged it exists, it would therefore be difficult to set a threshold for RPN’s, a value which exceeded would mean the cause is automatically selected for action.
Teams should select the number of causes that can be sensibly coped with given available resources, they can make recommendations for longer term actions.
The RPN is not the only criteria for selection.

SYSTEM FMEA – Severity
User experiences discomfort. Overall system performance is impaired but is operable and safe. Partial loss of system function, but operable.
SYSTEM – Occurrence

CNF/1000 = cumulative number of Failures per 1000 elements over the design life of the system.
Example 2 elements per system and one system will be installed per build. The element design life is 50,000 cycles and the build life is 200,000 cycles. The team estimates one element failure per 1,000 cycles.
CNF/1000 = ( 1 failure/1000 elements) x (2 elements/system) x (200,000/50,000 cycles) = 8
Referring to the table it is between 5 and 6 so the higher rating is entered.
SEVERITY – Detection

MACHINE FMEA – Severity

MACHINE FMEA – Occurrence

MACHINE FMEA – Detection

SEVERITY Evaluation for a PROCESS FMEA
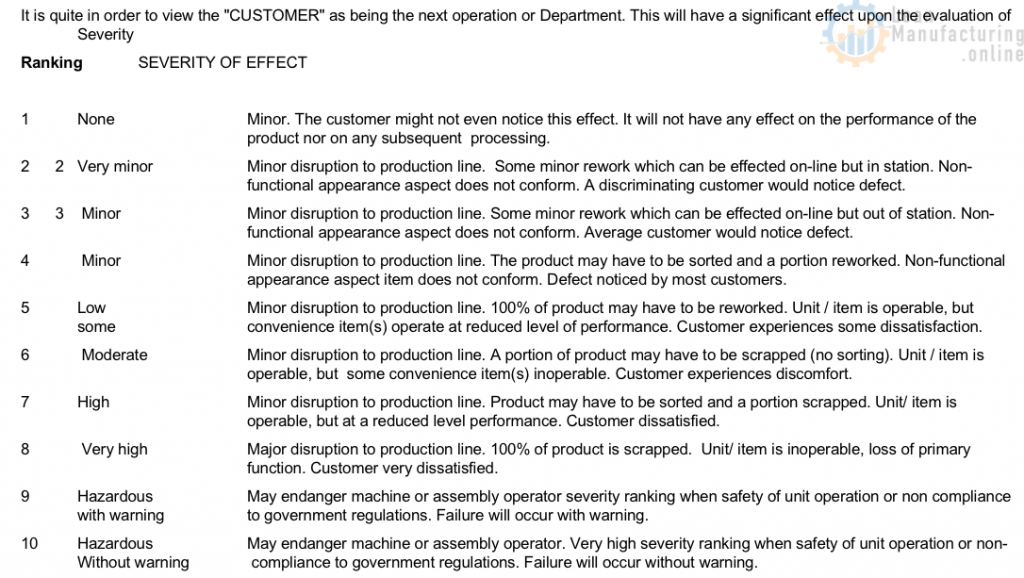
PROCESS – OCCURRENCE SCALE
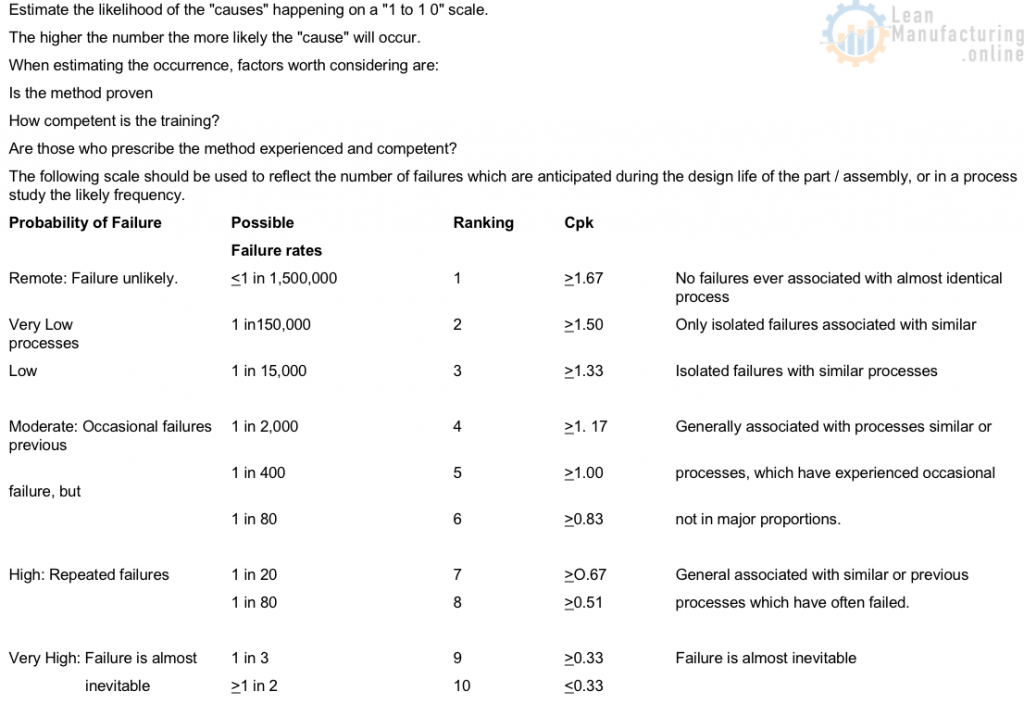
PROCESS – DETECTION
Download Template here

