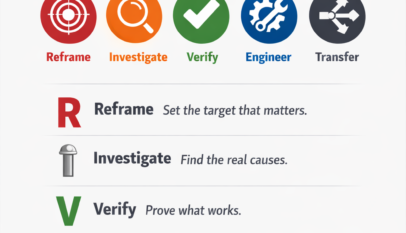
Focused Improvement
The 7 QC Tools – Pareto and Scatter Diagrams
The losses may also be classified by their causes or by the situations in which they appear.
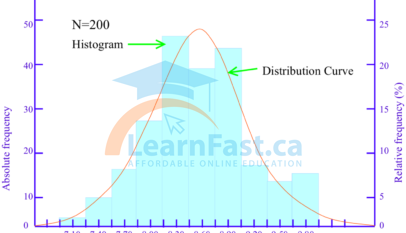
Read More »The 7 QC Tools – Histograms
(3) Histograms Although the overall distribution pattern can be deduced from the data points in a frequency distribution table, the distribution can also be represented as a column graph, known as a histogram (see Figure “A Histogram”). The histogram is employed to reveal mean values and variation patterns, the histogram…
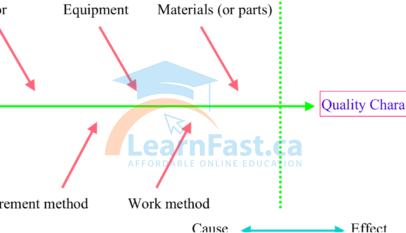
Read More »The 7 QC Tools – Ishikawa Diagram and Checksheets
(1) Cause-and-effect diagrams The cause-and-effect diagram (also known as the fishbone diagram or Ishikawa diagram) was developed by the Japanese quality guru Dr. Kaoru Ishikawa to express one of the basic principles of total quality management, that the desired product, target or other outcome is achieved not by directly controlling…
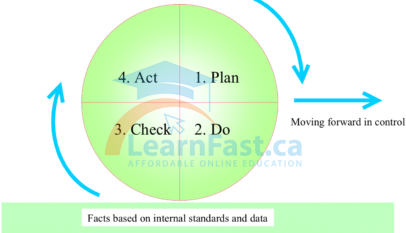
Read More »Focused Improvement – The QC Story
The QC story (or Improvement Story) is a simple, practical way of doing this and thereby solving problems efficiently.
Read More »

4M Analysis Process
The purpose of this procedure is to define the steps to do a 4M …