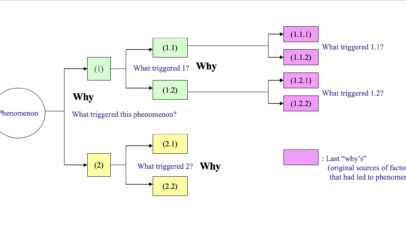
(1) Cause-and-effect diagrams
The cause-and-effect diagram (also known as the fishbone diagram or Ishikawa diagram) was developed by the Japanese quality guru Dr. Kaoru Ishikawa to express one of the basic principles of total quality management, that the desired product, target or other outcome is achieved not by directly controlling the results themselves but by controlling the processes that produce those results (since a process is a collection of causes leading to the results).

Note: Cause-and-effect diagrams are sometimes called as ‘4-M Diagram’ or ‘4-M Analysis’ (Man, Machine, Material, Method)
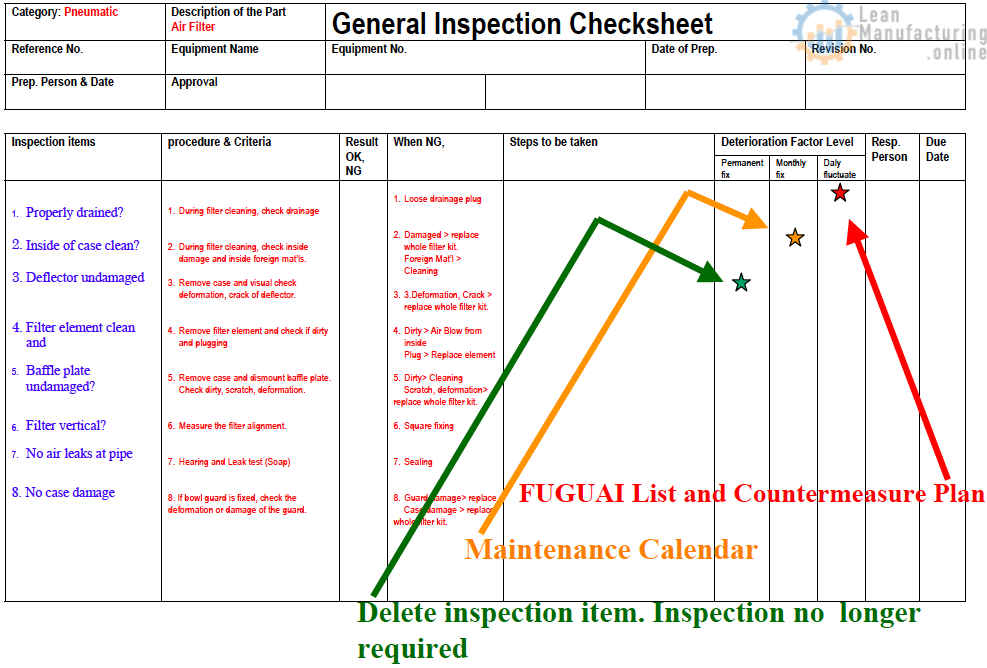
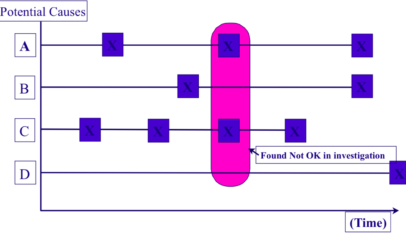
(2) Checksheets
Checksheets are printed lists or diagrams of information required for control purposes. Once dealt with, each item is ticked, making data collection more efficient and transparent.
Checksheets can be designed to investigate the distribution of process parameters, the occurrence or causes of product defects, or the location of equipment defects.


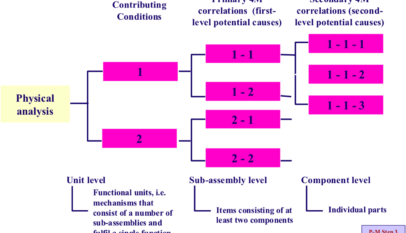

4M Analysis Process: Root Cause Guide for Manufacturing
Learn how to use 4M Analysis to find manufacturing root causes across People, Machine, Method, and Material with diagrams, examples, and checklist.


Thanks for posting.