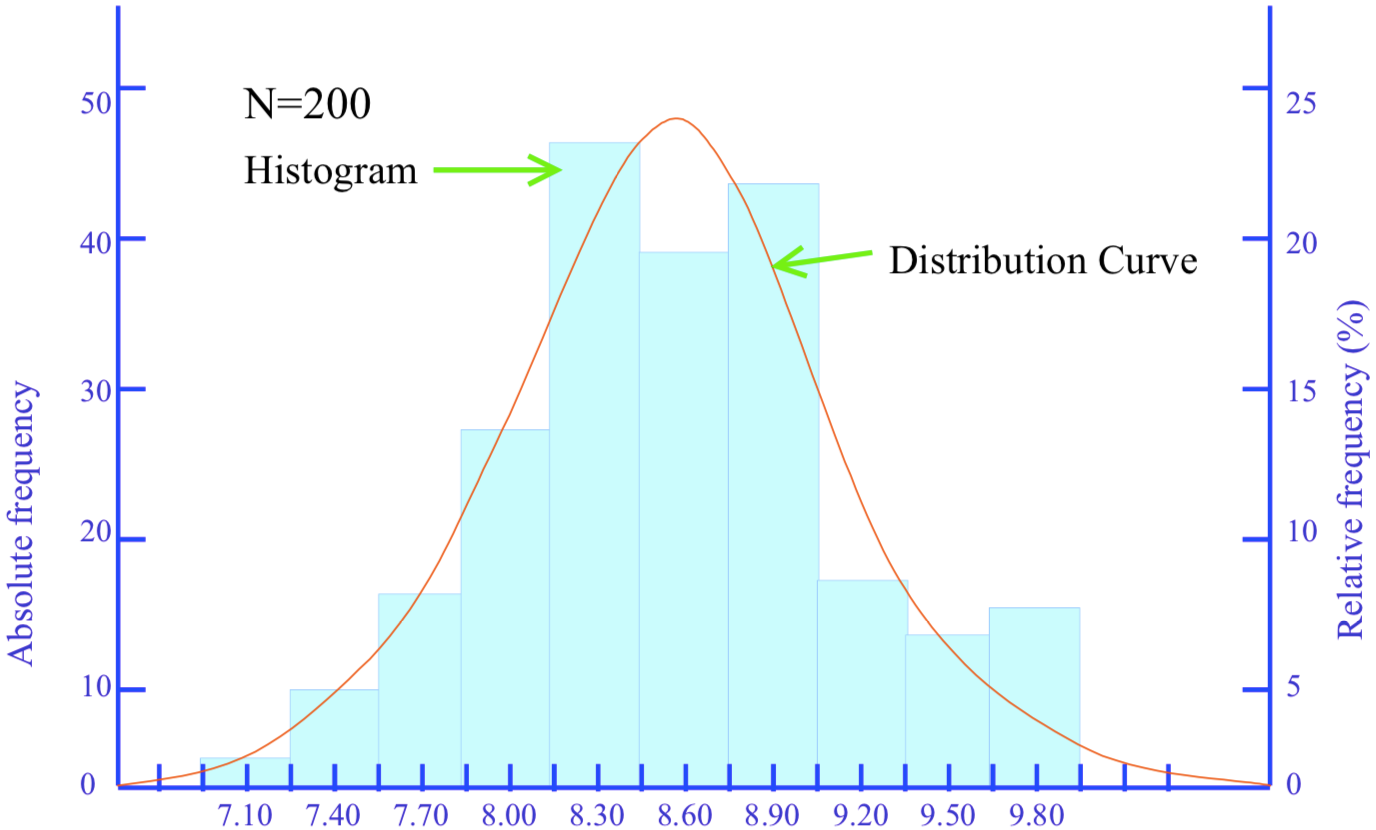
(3) Histograms
Although the overall distribution pattern can be deduced from the data points in a frequency distribution table, the distribution can also be represented as a column graph, known as a histogram (see Figure “A Histogram”). The histogram is employed to reveal mean values and variation patterns, the histogram plays an important role as a process analysis technique for tasks such as checking for defectives by comparing product quality characteristics against standard values.
1 Frequency Distribution Tables
In a frequency distribution table, quality characteristic data are sorted into several regularly-spaced classes, arranged in size order, to find how many values each class has. The frequency of a class is the number of values appearing in that class (or the number of times the same value appears, if each data value is taken as a class), and a frequency distribution table is a tabulation of the number of data points in each class.
A good indication of the overall distribution pattern can usually be found by gathering a hundred or more data points and drawing up a frequency distribution table by distributing them between 10 to 20 classes.
2 Normal Distribution
The normal distribution is the most common distribution pattern for a variable. It produces a bell-shaped distribution curve that is laterally symmetrical about a central line (see Figure “Normal Distribution”).
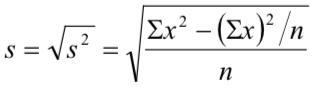
3 Standard Deviation
Standard deviation is used to express the variability of data quantitatively. ‘Variability’ is the degree of dispersion of the data (how spread out they are), and it can be made visible in the form of the distribution curve created by plotting a histogram.
A ‘deviation’ is the gap between a particular data point and the mean of the sample from which the data point was taken. The sample’s ‘variance’, s², is the sum of the squares of all the deviations, divided by the number of data points. The square root of a sample’s variance is called its ‘standard deviation’, and is represented by the letter ‘s’. It can be calculated using the following formula:


4M Analysis Process: Root Cause Guide for Manufacturing
Learn how to use 4M Analysis to find manufacturing root causes across People, Machine, Method, and Material with diagrams, examples, and checklist.


