Fault tree analysis (FTA) was developed in 1962 and is frequently used in safety and reliability engineering fields. FTA is employed in almost every engineering discipline and provides a framework using which the defects and weaknesses of a system can be analyzed qualitatively or quantitatively.
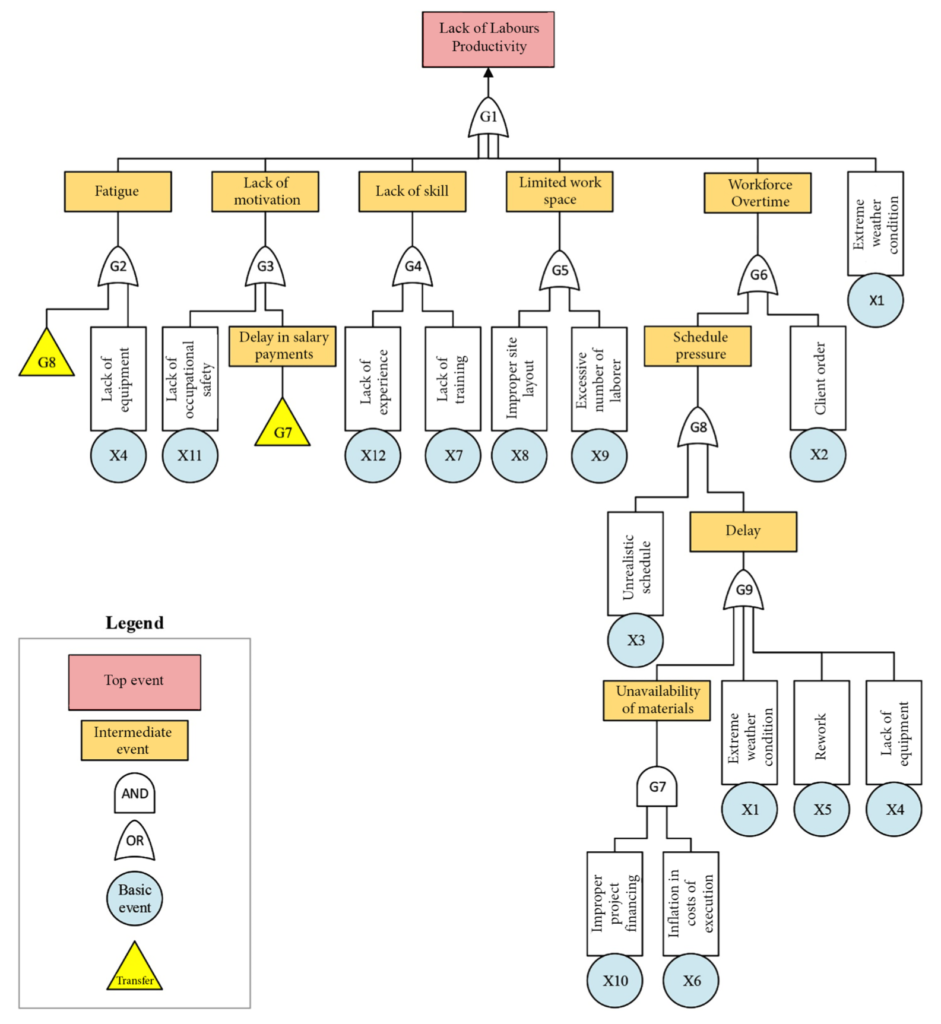
A fault tree is a structured logic diagram that shows the cause and effect relationships among events in systems. Fault tree analysis begins with a “top event” to be analyzed that generally is displayed with a rectangle and related events based on logical relations with the top event that are drawn below, branching downward as in a tree.
The top event defines the failure mode of the system or its function, which is then analyzed in terms of the failure modes of its components and influencing factors. FTA begins to identify the causes of an undesired event, namely the top event and proceeds to their root causes with a treelike structure until all possible primary events are reached. After the identification of the top event, inter-mediate events should be defined. An intermediate event is any event except the top event that could be broken into events that could cause it.
This process continues until all root causes are identified, namely basic events and gate events, which show the lowest level in a fault-tree structure. The relationships between events, including top event, intermediate event and basic event, are described and presented by logical gates, including AND gate, OR gate, Inhibit gate and other logic gates. AND gate indicates that if all lower events occur, the up- per event will occur. OR gate means that the occurrence of any of the lower events would result in the upper event.
