- What is a Fishbone Diagram?
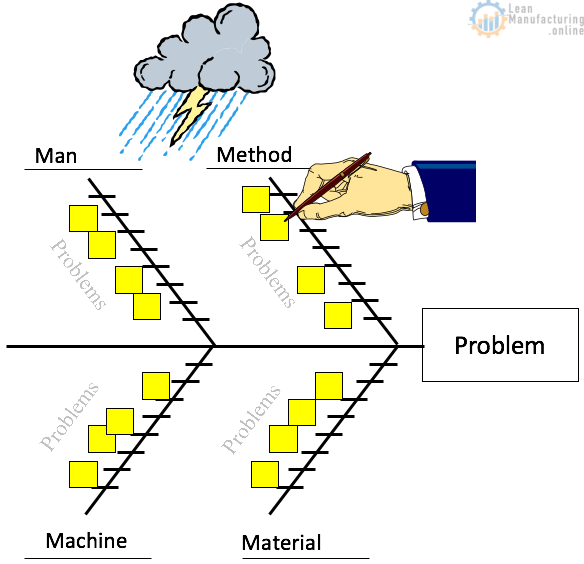
- A Fishbone Diagram is a “Cause and Effect” diagram. The importance of the FBD is that it uses visual power to highlight the problems and the relationship between problems and their potential sources.
- When to use a Fishbone Diagram?
- When a simple approach is needed to reduce the effect of a problem(s);
- When identifying possible causes for a problem;
- When problem-solving has gone stale, and the team needs a fresh approach.
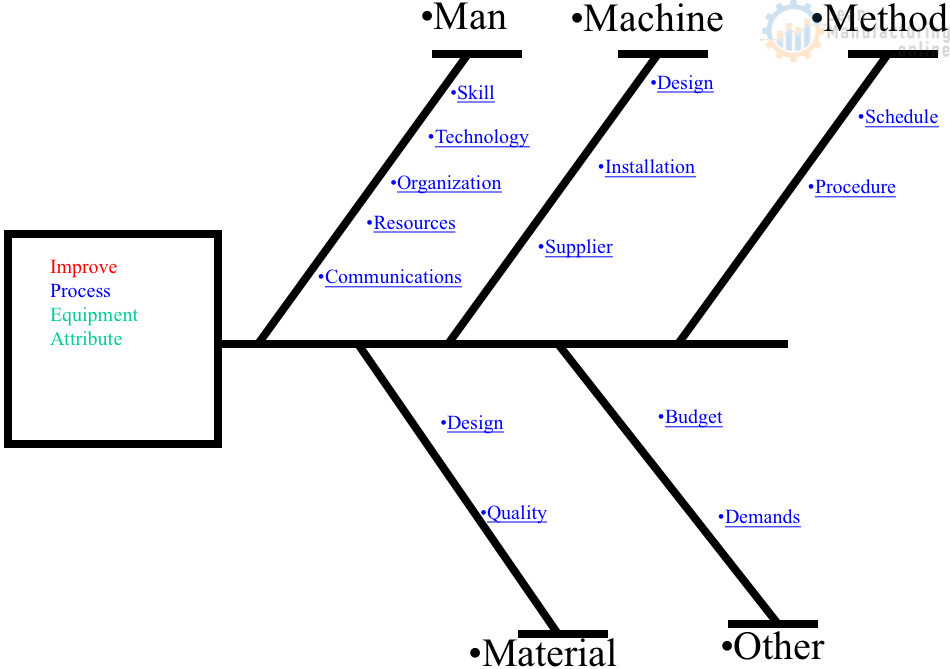
This is a typical example of a Fishbone Diagram template. Generally, there are six major branches (some header titles may be varied):
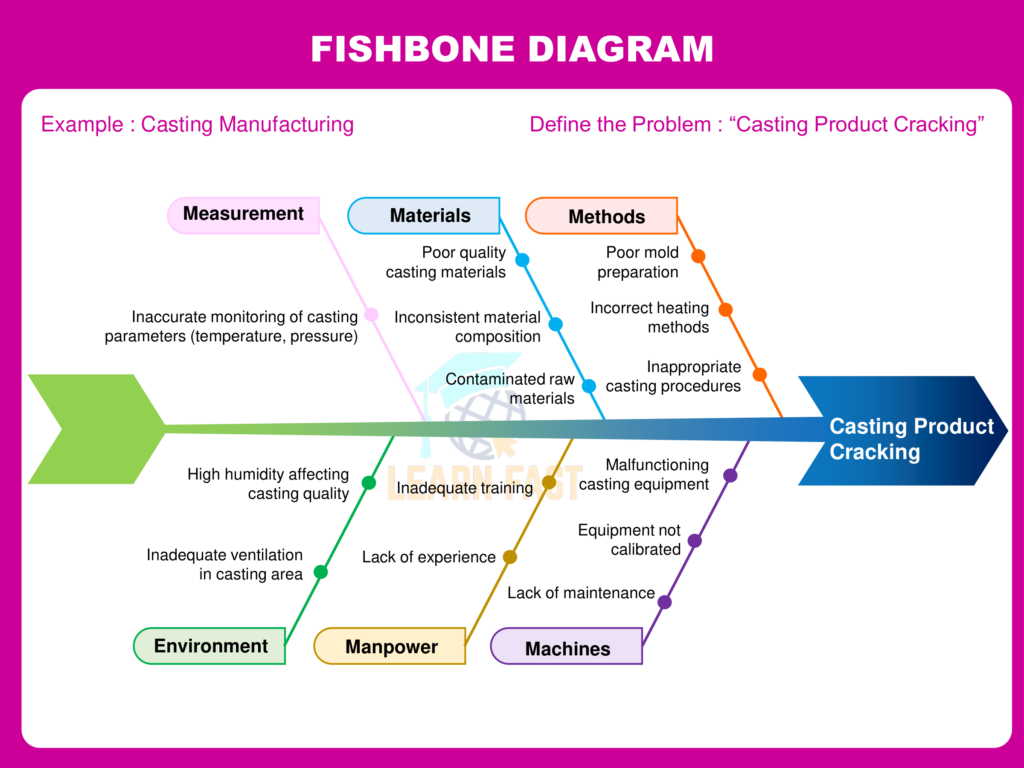
- Material
- Man or manpower (People)
- Machine
- Method (Process)
- Measurement
- Mother Nature (Environment)
Fishbone procedure
Requires input from a group of people. Use it when the problem is complex, and you are unsure of the most likely cause.
- Agree on a problem statement (effect) and write it at the end of the horizontal arrow.
- Brainstorm the causes that influence the effect – do this for all categories (branches).
- Arrange and strategize the causes. Decide on principle causes and show these as the major branches of the horizontal arrow.
- Create sub-branches for the causes. Continue to subdivide all the causes for each branch until all causes are included.
- Review the chart to ensure all known causes of variation are included.
Fishbone diagram completed
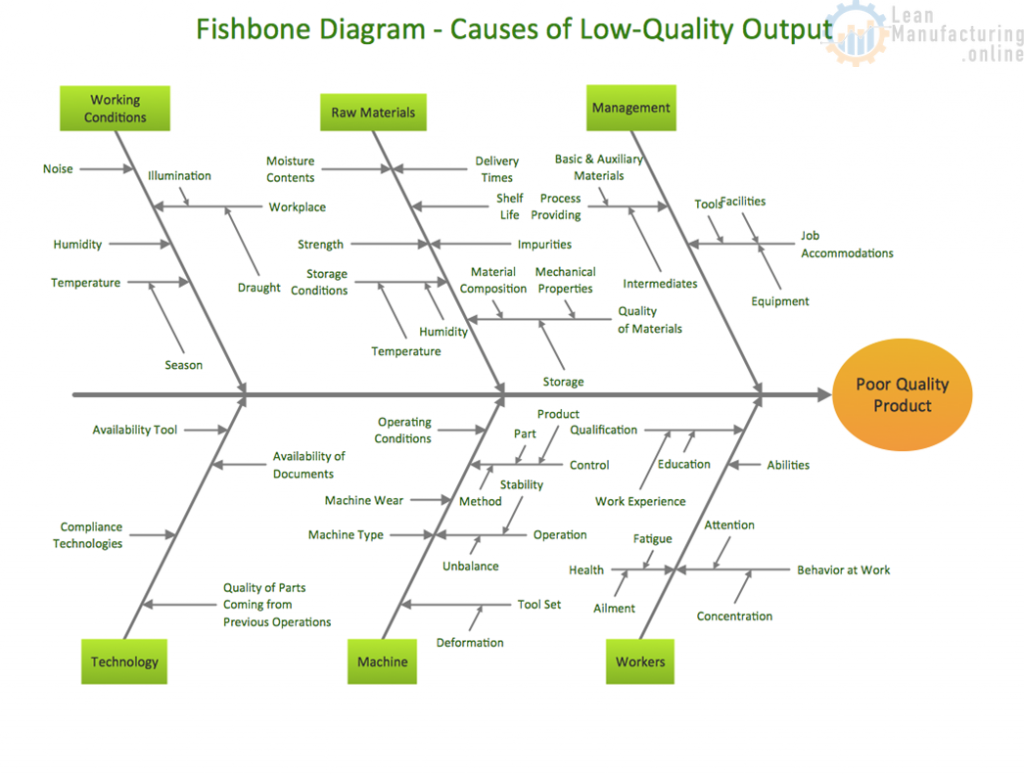
Fishbone Diagram Example

Once the Fishbone is created, the team should decide:
- Do we need to collect data at certain processes?
- Do we need to revisit any causes or factors for reconsideration?
- Make an action item list for all opportunities and follow through
Good to Great
When a process is predictable (in control), the Fishbone diagram will assist in identifying continuous improvement opportunities for a better process.
Improvement
When a process is unpredictable (out of control), Fishbone can identify areas for continuous improvement by removing non-value-added activities to create a more stable process.

