The Perfect Production Daily Dashboard
On the shop floor, speed and clarity matter. The quality of the information in front of you influences every decision you make. A well-designed production dashboard is not just a report—it’s a conversation starter, a guidepost, and a catalyst for real change.
Start with What Matters
The first rule of any effective dashboard is simplicity: answer the question, how are we doing today?
This means focusing on the vital few KPIs that leaders and teams can act on immediately:
- OEE (Overall Equipment Effectiveness) – the big picture view.
- Availability – how well assets are running vs. scheduled time.
- Performance – how quickly production runs against standard.
- Quality – how much good product is being produced.
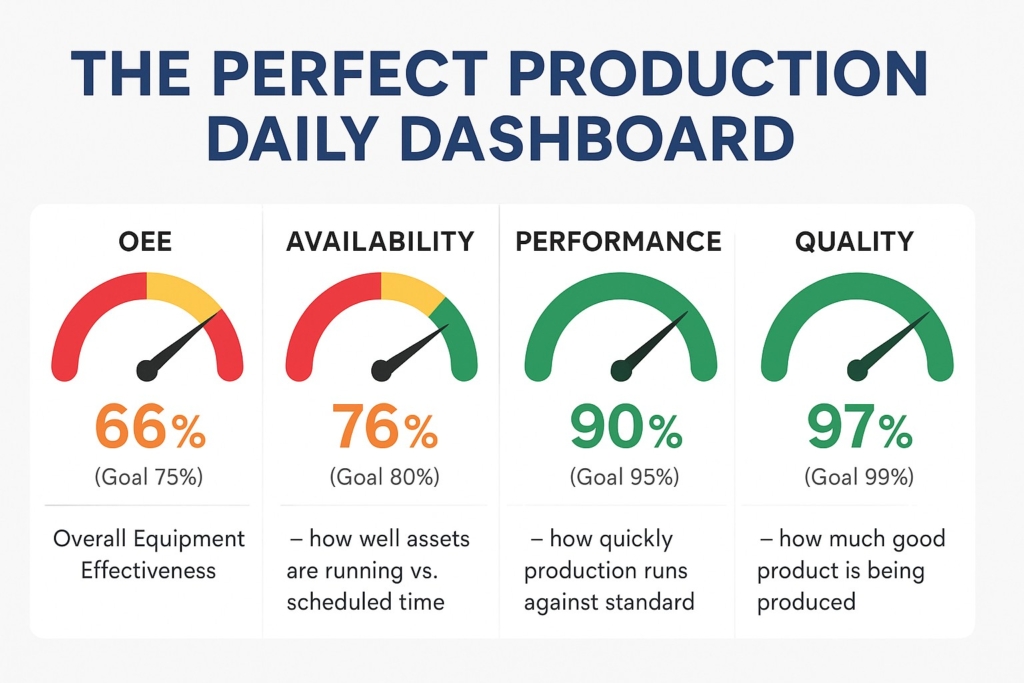
Each KPI should be shown with actual performance against a clear goal. That contrast between current reality and the target is what prompts action.
Zoom In to Understand Why
Once you know where you stand, the next step is to understand why. This is where a strong dashboard goes beyond surface-level reporting.
Break down the data by machine, line, or SKU. Display line-level efficiency. Use Pareto charts to highlight top downtime reasons—whether it’s sealing failures, misprogramming, or sensor issues.
This layer of insight helps leaders move from “we have a problem” to “this is the root cause, and here’s where we act.”
Improvement is a Trend, Not a Snapshot
One day’s data never tells the full story. Trends matter more than snapshots.
Dashboards that track data over days and weeks allow leaders to see whether issues are isolated or systemic. Is downtime on a particular machine creeping up? Is labor efficiency improving after changes in scheduling?
With trends, leaders validate whether countermeasures are working and whether problems are truly solved. This transforms a dashboard from a daily report into a strategic tool.
Dashboards Don’t Fix Problems—People Do
At the end of the day, dashboards don’t solve issues. People do. The real power of a dashboard lies in sparking meaningful conversations during daily standups, CI meetings, and coaching sessions.
When teams use dashboards to guide discussions, they move past finger-pointing and focus on solutions. Leaders gain visibility, but more importantly, they gain alignment.
The goal isn’t just visibility—it’s creating a culture where numbers translate into action, and action drives results.


4M Analysis Process
The purpose of this procedure is to define the steps to do a 4M …


