Excel for Supply Chain Planners: Unlocking the Right Formulas
Supply chain professionals handle a constant flow of data—demand forecasts, supplier lead times, shipment schedules, and more. While advanced systems exist, Excel remains one of the most powerful and accessible tools in the industry. The key is knowing which formulas to use and how to apply them in real-world situations.
Let’s walk through some of the most useful formulas for supply chain planners and explore how each one makes your job easier, faster, and more accurate.
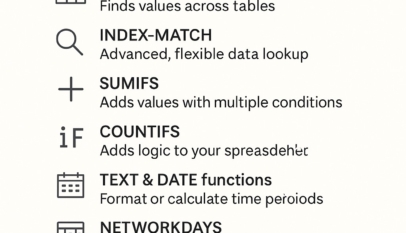
VLOOKUP / XLOOKUP: Connecting the Dots
At the heart of supply chain management is the ability to connect information across different tables. VLOOKUP and XLOOKUP make this possible.
Imagine you have a demand forecast in one file and a master list of product attributes in another. Instead of manually searching for matches, a lookup function instantly connects the two. This not only reduces errors but also speeds up decision-making when time is critical.
The difference between VLOOKUP and XLOOKUP? XLOOKUP is more flexible, works in both directions, and doesn’t break as easily when data shifts.
INDEX-MATCH: The Flexible Alternative
While lookup functions are popular, INDEX-MATCH is often the preferred choice for planners who need more control.
For example, if you want to retrieve sales history for a SKU across shifting months, INDEX-MATCH will adjust even when the data layout changes. It avoids many of the limitations of VLOOKUP, making it a reliable tool for long-term planning.
This formula is especially useful when dealing with historical data or when working with evolving datasets that don’t stay in the same structure.
SUMIFS: Adding with Precision
Demand aggregation is a daily task for supply chain teams. SUMIFS allows you to sum values based on multiple conditions.
Want to know total demand for a specific SKU type in a particular region for one month? SUMIFS gives you the answer instantly. Instead of spending hours sorting and filtering, you can structure your formula once and reuse it every reporting cycle.
This function is invaluable for dashboards and recurring analysis.
COUNTIFS: Spotting What Matters
Counting might sound simple, but in supply chain planning, the right counts reveal hidden problems. COUNTIFS enables you to apply multiple rules when counting records.
For instance, you can count how many high-priority orders missed their delivery dates. This quickly highlights potential risks and allows teams to act before the situation escalates.
It’s a formula that shifts focus from “how much” to “what really matters.”
IF / IFS: Adding Smart Logic
Not every decision is black and white. The IF and IFS formulas let you add logic into your spreadsheet.
One practical example is flagging orders for air freight if the lead time exceeds 30 days. Instead of manually scanning through long lists, Excel applies the rule for you and marks the orders automatically.
This builds intelligence into your sheet, helping you manage by exception.
TEXT & DATE Functions: Controlling Time
Supply chain timelines are everything. TEXT and DATE functions allow you to format or calculate time periods effectively.
For example, you can convert shipment dates into fiscal weeks or calculate lateness in days. This makes reporting clearer and ensures that planners can align schedules with business calendars without guesswork.
These functions transform raw dates into insights that make sense to decision-makers.
NETWORKDAYS: Measuring Lead Times
Suppliers and logistics teams don’t work seven days a week, so using calendar days to measure lead times can be misleading. NETWORKDAYS calculates only the working days between two dates.
This is perfect for measuring supplier lead time between a purchase order date and the actual receipt date. By excluding weekends and holidays, the measure becomes far more accurate.
Accurate lead-time data supports better negotiations with suppliers and stronger planning models.
ROUND, CEILING, FLOOR: Aligning to Reality
In supply chain operations, quantities don’t always come in neat numbers. You may need to round up to full pallet loads or round down to carton sizes.
ROUND, CEILING, and FLOOR functions control this behavior. By applying them, you ensure that planned order quantities align with packaging or shipping realities. This reduces waste, avoids excess handling, and keeps operations practical.
FILTER: Focusing on What Matters Now
When supply chains are under pressure, planners need to prioritize. The FILTER function allows you to pull only the data that meets your criteria.
Need to see only the urgent orders due this week? FILTER extracts just those records, cutting through the noise. This makes it easier for teams to focus their energy where it counts most.
CONCATENATE / TEXTJOIN: Creating Unique Keys
Complex supply chains require precise tracking. CONCATENATE and TEXTJOIN allow you to combine data from multiple fields into one unique key.
For example, by joining SKU, location, and version into a single string, you create a unique identifier that reduces confusion and improves data clarity. This helps when managing large datasets across multiple regions or systems.
Putting It All Together
Each formula serves a unique purpose, but the real power comes from combining them. A planner who uses SUMIFS to aggregate demand, NETWORKDAYS to measure supplier performance, and FILTER to isolate urgent orders can respond faster and with more confidence.
Excel may be decades old, but it remains one of the most versatile tools in supply chain planning. Mastering these formulas equips professionals with the ability to move from reactive firefighting to proactive decision-making.


4M Analysis Process: Root Cause Guide for Manufacturing
Learn how to use 4M Analysis to find manufacturing root causes across People, Machine, Method, and Material with diagrams, examples, and checklist.


