4. Dosing Accuracy
This chapter covers required and actual dosing performance. Dosing accuracy needs to meet quality requirements, legal requirements and factory costs.
4.1. Quality and Quantity guarantee
The target weight distribution should meet quality and legal requirements in the most economic fashion (no systematic overfill, no packages to re-empty due to under- or overweight).
Quality tolerances must be defined by marketing and product development and the applicable authorities provide legal tolerances.
The key to proper weight control is the ability to monitor and control the dosing process. A statistical process control method is used to obtain and process data on product weights.
4.2. Statistical methods and quality
Quality-related requirements are imposed when package content must, for organoleptic reasons, fall between minimum – and maximum limits. Legislation on ingredient quantities also results in such requirements.
The maximum allowable production scatter will depend on the upper and lower quality limits (UQL, LQL) and the position of the mean value between them.
UQL and LQL in relation with the Gauss curve
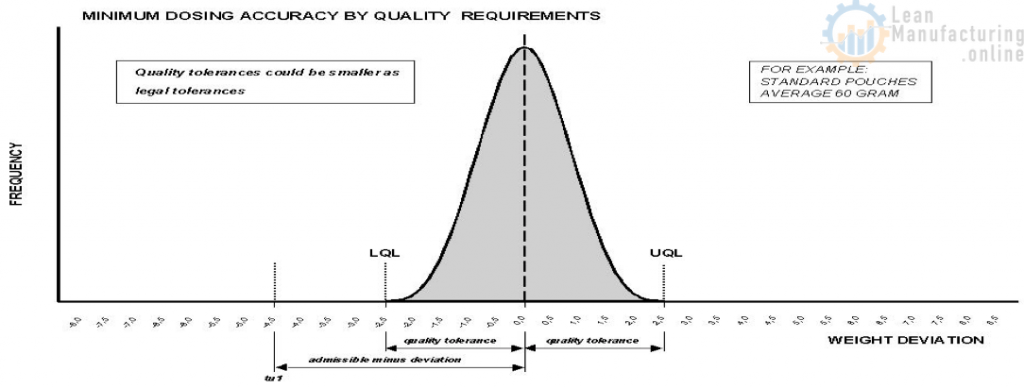
The maximum allowable production scatter will be the greatest if the mean weight value lays dead centre between the upper and lower limits (see figure “The maximum allowable production scatter within the Gauss”). The further the mean value lies off centre, the smaller the production scatter must be in order to stay within the allowable limits.
The maximum allowable production scatter within the Gauss
The aim is therefore to control the dosing process so that mean weight of the produced lot is as close as possible to the nominal weight requirement.
4.3. Statistical methods and quantity
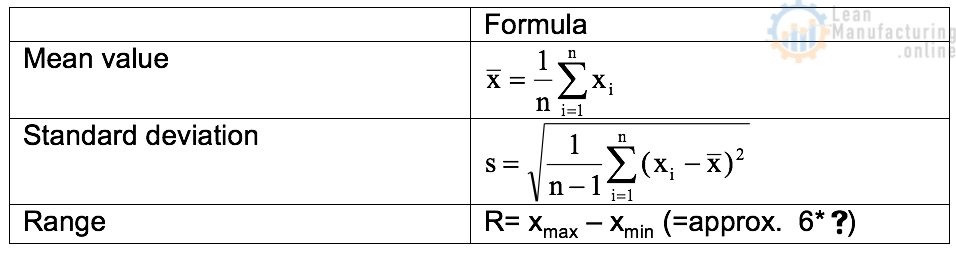
A deviation error in weighing is the difference between the desired weight value and the actual weight average of a produced lot. The difference between the heaviest and lightest package of a produced lot is called range (ref. Fig. 19). The weight scatter will be expressed as “standard deviation”.
Mean value * average amount of product filled into each package.
Standard deviation (=SD) * scatter of the individual package weights within the produced lot.
Standard deviation and the Gauss curve
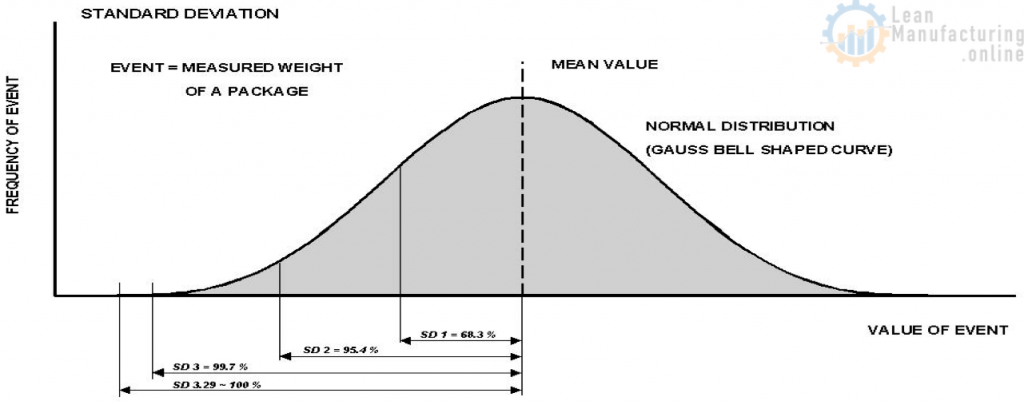
The characteristics of this distribution are:
About 68.3 % of all events are between ± 1x the standard deviation
About 95.4 % of all events are between ± 2x the standard deviation
About 99.7 % of all events are between ± 3x the standard deviation
About 100 % of all events are between ± 3,29x the standard deviation
This means that 0.3% of package weights will fall outside ± 3x the standard deviation.
4.4. Reasons for reject
A package may be rejected for one of the following four reasons:
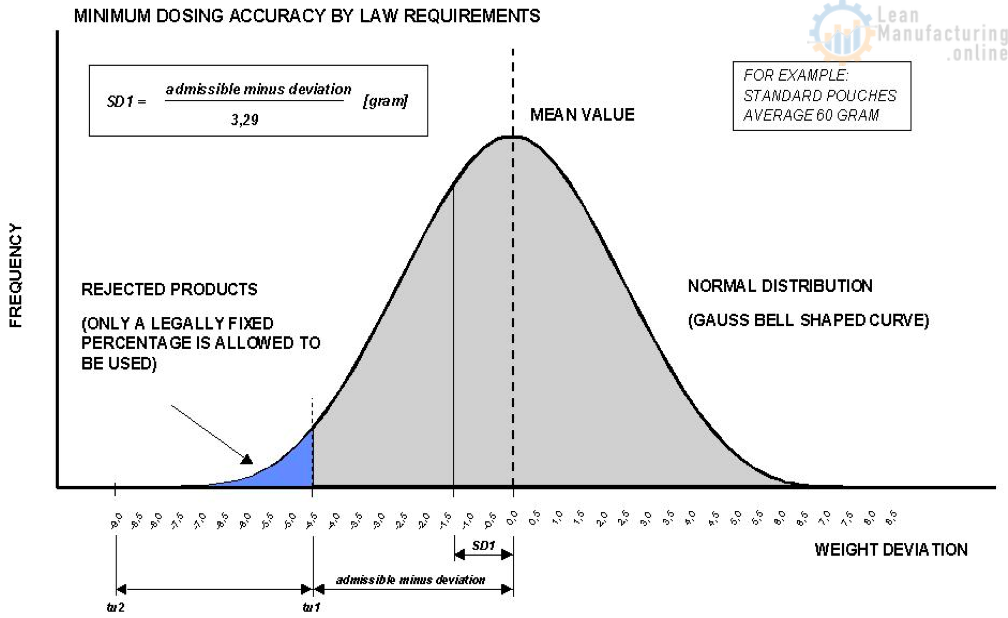
• Legislation requirements; the admissible minus deviation is smaller than the dosing variation;
• Quality requirements; the admissible quality deviation is smaller then the dosing variation;
• Technical malfunctioning of the dosing unit
• Out of specification product behaviour; may be caused by high fat content or wrong mixing properties.
4.5. Assessing weight control performance – statistical examples
For the example below the following is assumed:
• Quality weight is 100 g;
• The allowed minimum and maximum tolerance from the quality amount is 4.5 g, given by the quality requirements;
Example:
• Minimum allowable quality weight = 100 – 4.5 = 95.5 g
• Maximum allowable weight =100 + 4.5 = 104.5 g;
• Standard deviation SD = 2 g -> Range = 6×2 = 12 g;
• Under the given circumstances the accepted minimum value is: quality weight – 3xSD -> minimum value =100 – 6 = 94 g;
• Under the given circumstances the accepted maximum value is: quality weight + 3xSD -> minimum value =100 + 6 = 106 g;
• In this example, between the boundaries 95.5 g – 104.5 g the package is accepted, outside it the package is rejected.
4.6. Assessing the accuracy of trials
It is obvious that statistical analysis is the best tool for judging whether the results from a test run meet the quality and quantity requirements. An example of this analysis is given below:
For this example the following is assumed:
• Quality weight is 100 g;
• The allowed minimum and maximum tolerance from the quality amount is 4.5 g, given by the quality requirements;
• Acceptance of 100%, so no rejects are allowed. As already explained for 100% acceptance the events are between ± 3,29 x the standard deviation.
Example:
• The calculated standard deviation is 4.5/3.29 = ±1.4 g;
• If the actual standard deviation is higher than 1.4 g, it will result in further rejects during the production. The applied dosing unit and the recipe will be reconsidered and new trials have to be prepared.
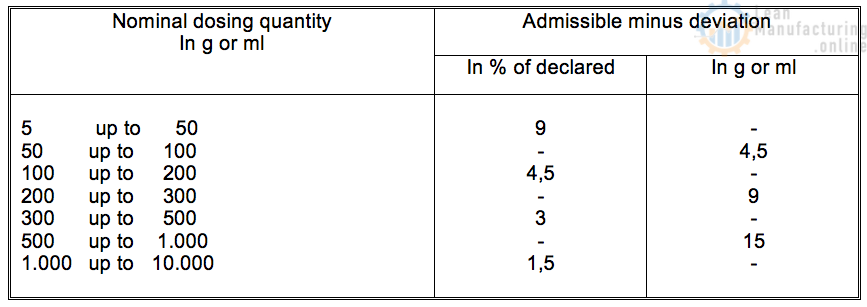
4.7. Legal weight control requirements
The average achieved package weight needs to be at least equal to the declared weight as indicated on the product packaging.
The dosing operation will lead to a certain weight distribution around the average weight.
The permissible underweight deviation relative to declared weight is listed in the table below.
These rules are according to the European Union legislation. For other parts of the world, other legislation will apply. Please ensure that the applicable legislation is used in each case.
European legislation
5. Selection of the most suitable dosing system
When important prerequisites such as the characteristics of the ingredients, required dosing accuracy and dosing speeds have been defined, then the equipment selection process can start. The selection of the equipment has to be guided by a local focal point, who will give advice and support the discussion about technical details with the vendor. The selection methods provided in this chapter have to be considered as an aid for those who do not have the level of technical experience.
5.1. Explanation of the selection approach
Selecting a dosing unit seems straightforward, there are however many pitfalls in the selection process. The many variables involved in equipment selection are a complicating factor. This results in thousands of different combinations between product, primary packaging systems and dosing units. The consequence is that mistakes are easily made in selecting a dosing unit.
Main factors in the selection of a dosing unit are ingredient behaviour and the type of primary packaging. It is obvious that the product properties, the pack style and the quality requirements are a given and provided by product development and marketing. In addition, supply chain management imposes the required production capacity. Based on these input parameters a dosing unit has to be selected. The scheme in figure below gives a simplified impression how to ultimately select a dosing unit.
Selection process scheme

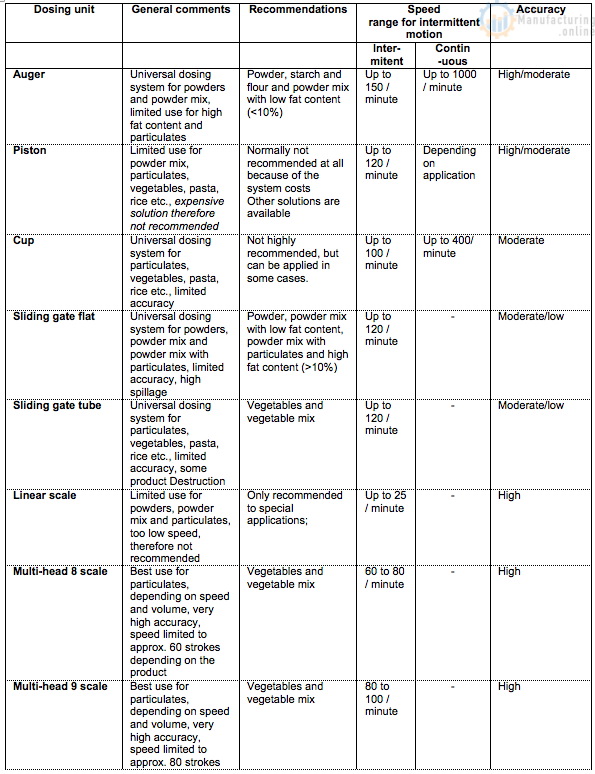
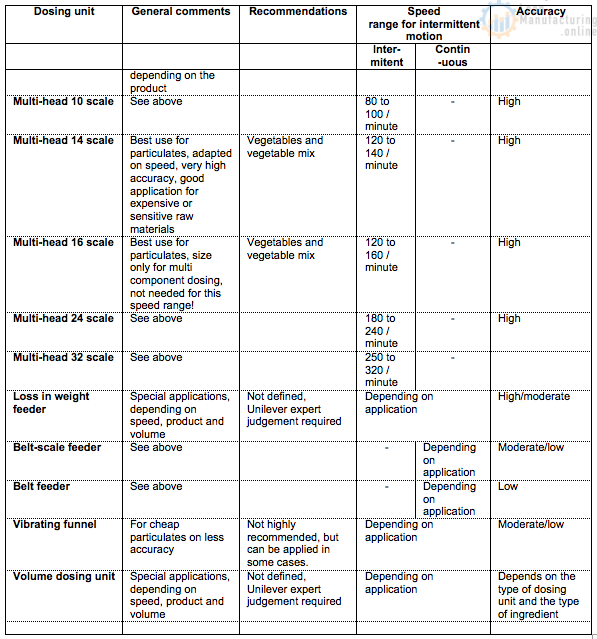
5.2. Quick dosing system assessment
For a quick dosing system assessment, the following selection table can be used (ref. table below). The table will for each system indicate the issues which impact the performance of the dosing system, the type of ingredients which can be dosed, the achievable accuracy and speed of the dosing system.
Selection matrix overview
5.3. Detailed dosing unit selection
Final selection will be done through the overall selection matrix. The application of the matrix is explained in this paragraph. The questions, shown in the selection process scheme, will be used as a guide to the overall selection matrix.
1. How many packages need to be dosed per unit of time?
The production rate depends on the type of primary packaging machine. A specific selection matrix is provided for each of the following types of primary packaging machine:
– Horizontal pouching machines for low speed application;
– Horizontal pouching machines for medium speed application;
– Intermittent high-speed pouching machines;
– Continuous high speed pouching machines;
– Bag in box machines;
– Vertical pouching machines for low speed application;
– Vertical pouching machines for high speed application;
– Can filling machines;
– Tablet presses;
– Sack or bucket filling machines.
2. What is the degree of flowability?
In the first column of each recommendation sheet the types of ingredients are given and in the second column ingredient behaviour or appearance is described. Once the most applicable ingredient entry has been identified, the most suitable dosing units can be found on the selected matrix row.
3. Which dosing unit can meet the required accuracy and quality requirements?
The highly recommended dosing units will meet dosing accuracy requirements. Also product quality has to be met, no mechanical damage, caking or agglomeration is to be expected.
4. The above procedure will lead to a close match of dosing unit to production requirements. A test run with the selected unit is however compulsory to check if all requirements can be met in practice.
The selection matrix uses the following recommendation levels:
1. Highly recommended -> The dosing system with this qualification is the best practice for the specified application;
2. Good -> Dosing system performance is acceptable for the type of application, but there are some disadvantages;
3. Limited use -> Can only be used under certain conditions;
4. Poor -> This application can be used but the performance is doubtful, normally it should be avoided. Under some special circumstances it could be used;
5. Not recommended -> Do not use this application at all;
6. Undefined (blank cells) -> Test runs and an expert judgement is required.


4M Analysis Process: Root Cause Guide for Manufacturing
Learn how to use 4M Analysis to find manufacturing root causes across People, Machine, Method, and Material with diagrams, examples, and checklist.


