Quality Assurance Matrix (QA Matrix)
A QA matrix is a table that delineates how defects are being built into products under current conditions, in a process in which one wishes to assure quality. This matrix enables managers to see at a glance which processes are generating defects, which processes’ equipment and methods are faulty, and how these two are related.
Preparing a QA matrix
- Verify the standards for the product in question and uncover all of the quality characteristics and defect modes thought to be impeding the fulfillment of those standards.
- Draw a block flowchart for building-in of quality in all processes, encompassing each process (from major processes to auxiliary processes),
- Survey and confirm the status of defect occurrence and individual processes (from major processes to auxiliary processes).
- Delineate all quality characteristics and display their defect modes.
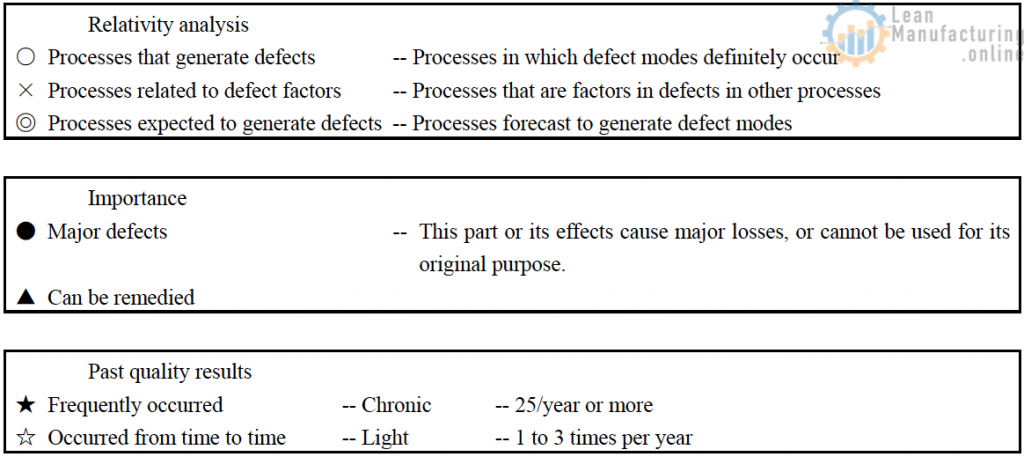
- Classify the quality characteristics according to the degree of importance of their defect modes (characteristic ranking), indicating past defective results that concern you.
- Repeat this procedure down to the smallest units of the process, so that the relationship with defect modes is visible.
Key points
- Have the manager responsible in the quality assurance division examine the classifications of a degree of importance (characteristic ranking), to perform classification from the perspective of defect modes.
- All managers responsible take part in relativity analysis, analyzing individual processes and defect modes.
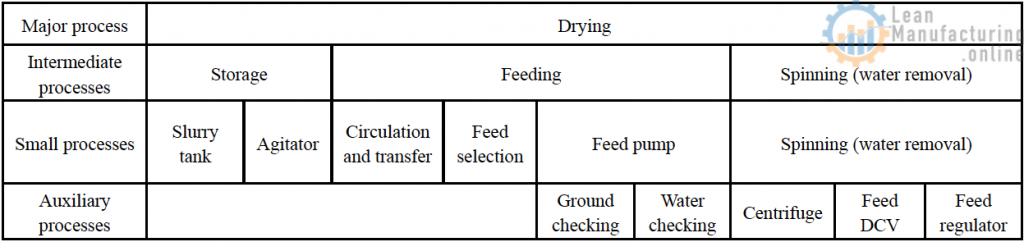
Examples of major processes and auxiliary processes
Ex: Product A (drying process)
Identifying the elements of product quality (required quality specifications) — Determining product standards
Examples of product standards
- Materials — Ingredients, structure, etc.
- The precision of form — Roundness, parallelism, perpendicularity, etc.
- The precision of dimensions — Diameter, outside diameter, length, thickness, etc.
- The precision of appearance — Foreign matter, color variance, scratches, cracks, etc.
- Chemical quality — Corrosion, lack of flammability, flame-resistance, etc.
- Electrical quality — Insulation, electrical conductivity, conductivity, etc.
Product standards — Precision of quality determined by design. These product standards are always determined by factors such as tolerance and scope.
Design quality — Excellent products cannot be created simply based on functional criteria such as “ease of carrying” or “compact, easy-to-carry form.” Rather, design quality elements such as shape, dimension, and weight, which are quality characteristics that correspond to these elements, must be determined before specific design efforts can begin.
Preparation of a QA matrix (sample)
Quality maintenance (QM) matrix
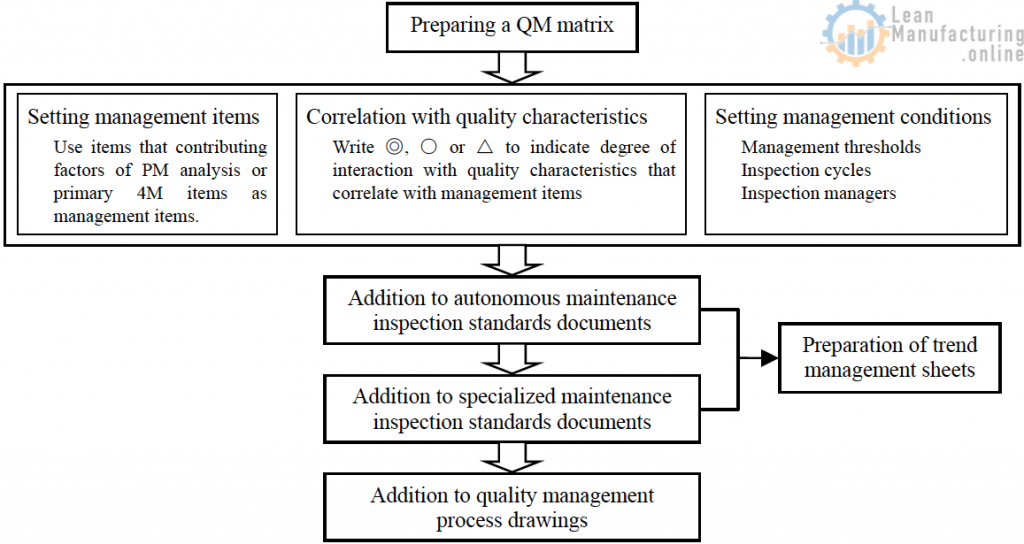
Preparation of a QM matrix
- Map out in a QM matrix table the relationship between quality characteristics and the survey items from the PM analysis table (including items that posed no problems in survey judgment) targeting chronic defects. The survey items are viewed as factors in chronic defects.
- Inspect the top constituent systems of the PM analysis table (contributing factors) as a representative sample.
- In the PM analysis steps, examine the management items and their inspection methods for the quality items for which steps against abnormalities were taken in step 4 as well as other quality characteristics, and map out their relationship to quality characteristics in a QM matrix table.
- Judge the level of impact of the management items on quality and rank the management items as ◎: high impact on quality, ○: medium impact on the quality, or △: low impact on quality.
- Determine the management items of the inspection method and management threshold, the inspection cycle (referring to the level of impact on quality items), and the inspectors.
- Add the management conditions to the equipment autonomous maintenance standards documents and autonomous maintenance check sheets.
- Add them to the management process drawings.
Standardization of quality maintenance inspection items
Deploying step 6 of autonomous maintenance
The usual approach to abnormalities is that, once it becomes clear that variance is large and defects exist, the underlying factors are rigorously sought out so that appropriate measures can be formulated. If defects have already started appearing, however, you have waited too long. With this post facto approach to management, even if prevention of recurrence is achieved, it is impossible to reduce defects to zero. In the quality maintenance deployed in step 6, the relationships between equipment and quality established in step 5 are further investigated. The precision of all related sections, including equipment, parts, jigs, and tools, is measured before defects occur, to check that they are in the required state so that any deviance from the required state can be fixed.
To carry out this approach to quality maintenance, conduct organizing and clearing-up of inspection items involved in quality using the following procedure.
Procedure
- Understand the functions of the products or parts in question.
- Confirm the quality standards and quality characteristics of products and finished goods using the QC process table.
- Organize the defects that occur in a “list of occurring defects,” indicating what kinds of defects occur and when, where, and how they occur, for each process.
- Clarify the structure, processing conditions, methods of operation, and setup methods of the equipment in which defects occur.
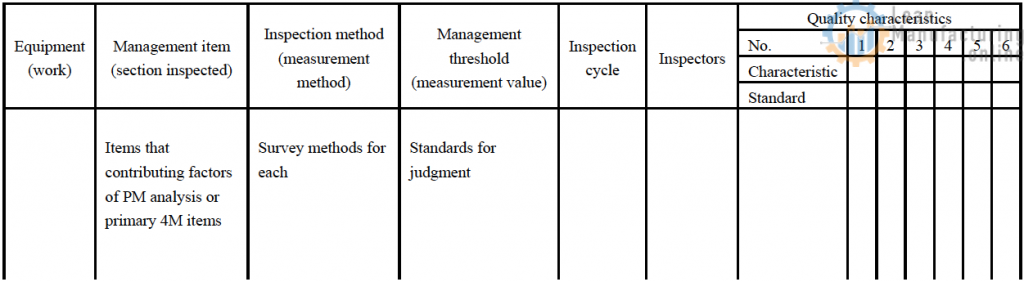
- Prepare a QM matrix indicating the range of precision required for the items in which measures against quality defects were carried out in sections that affect quality.
- Add the inspection items appearing in the QM matrix to the checklist of routine inspection items currently in use, and check regularly whether the precision they require is consistently supported.


4M Analysis Process: Root Cause Guide for Manufacturing
Learn how to use 4M Analysis to find manufacturing root causes across People, Machine, Method, and Material with diagrams, examples, and checklist.


May you please share with me a sample of AQ matrix ?
Hi Sami, thanks for your question. An AQ (adjacency-quantity) matrix, commonly used in network analysis or graph theory fields, represents relationships between nodes or entities. The adjacency part represents the connections, while the quantity part represents the weights of these connections.
However, it’s important to note that the interpretation of the AQ matrix might be unclear without context. Different fields or applications might have slightly different connotations of the AQ matrix.
Here’s a simplified example. Let’s say we have a network of three cities, A, B, and C. The roads between them are the connections, and the distances of these roads are the weights.
+ A B C
A 0 5 2
B 5 0 3
C 2 3 0
In this AQ matrix:
The adjacency is represented by the existence of a number between any two cities. A ‘0’ typically indicates no connection (or self-connection, as in the diagonal of this matrix).
The quantity is represented by the actual number (the weight). For example, the distance between city A and city B is 5, while the distance between city A and city C is 2.
It’s important to note that the context and actual application could greatly influence the interpretation of the matrix. For example, the matrix could represent things other than distances, such as the connections’ cost, time, or capacity.
I am new in the QA matrix. Suggest me some tips which are effectively to implement the QA matrix in our process and identify the defect.