In the Measure phase of a Six Sigma project, the team needs to collect data to measure the baseline performance of Y. Since it’s not always possible to measure every item n the population, samples are collected. So you might be wondering, “How do you sample?” and, “How much do you sample?” How to sample is called a sampling strategy, which we will review in this post.
- Understanding sampling concepts
- Areas of concern when sampling
- Sampling methods
- What sample size to use
- Making a sampling plan
- Understand the purpose of a Measurement System Analysis (MSA)
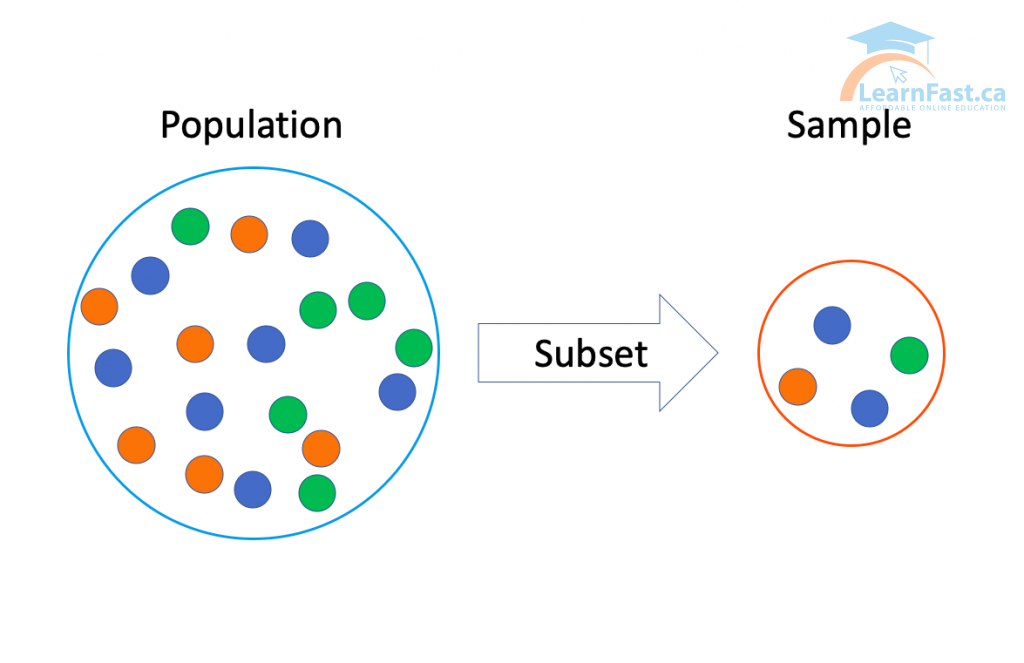
What is a sample?
Subset or segment, which is representative of a larger population, that can be studied with the purpose of forming opinions and making of a larger population, that can be studied with knowledge-based decisions.
A good sampling plan must be of adequate size—while there are mathematical equations that can determine the exact sample size needed.
Sampling Error
- Differences between the sample and the population solely due to the (way) units have been selected.
- Use a larger sample size!
- Free from bias – avoid collecting only when doing so is convenient, omitting shifts or collecting for a short time (ignoring long-term effects), or from responsive employees.
Sample Method
Balancing the need for accuracy and reliability with the demand for timeliness and economy.
Ensuring that the way in which the data have been collected is reliable and accurate.
Random Sample
With this option, each unit has an equal chance of being selected. It is a good option for homogeneous populations.

Random Sampling
Simple Random
Select “names from a hat”, all with equal chance
Stratified Random
Randomly selecting units at all ‘levels’ of a factor. For example, a random sample for each shift, location, day of the week, etc.
Systematic or Interval
Select the first unit at random and then sample every nth unit (for example, every fourth unit).
Rational Subgrouping
Rational subgroups are samples from similar processes (for example, comparing cycle time from production lines 1, 2, and 3) or items from the same process over time (for example, morning shift vs. afternoon shift). If selected correctly, subgroups help identify variation within the group and between the subgroups.
Determining sample size
The minimum sample size required for a statistically significant sample depends on three factors:
- Confidence level required, how much risk are we prepared to take. This is usually a business decision.
- Amount of the inherent variation in variable measured standard deviation of the population.
- Maximum allowable error expressed in the same unit as the parameter being measured.
Sample size and confidence
“The smaller the confidence interval required, the larger the sample size.”
Understand the relationship between sample size and the strength of the effect, the variability of the measurement, and the confidence in the results.
- Dependent on the confidence level (typically 95%) and confidence interval
- …state that you are 95% sure that the true percentage of the population (X) is between +/- confidence interval

Sample Size and Sampling Error
The smaller the acceptable sampling error, the larger the sample size.
Sampling Error being the acceptable confidence interval.

Example of Sampling Document


4M Analysis Process: Root Cause Guide for Manufacturing
Learn how to use 4M Analysis to find manufacturing root causes across People, Machine, Method, and Material with diagrams, examples, and checklist.


