| Tool | Use When | Example | Data Format | Y | Xs | p < 0.05 indicates |
| ANOVA | Determine if the average of a group of data is different than the average of other (multiple) groups of data | Compare multiple service centers to determine if one or more performs differently. | Response data must be stacked in one column, and the individual points must be tagged in another. | Variable or Continuous | Attribute | At least one data group has a different mean than one other group. |
| Box & Whisker Plot | Compare the median and variation between groups of data. It also identifies outliers. | Compare pallet weights using different scales. | Response data must be stacked in one column, and the individual points must be tagged in another column. | Variable or Continuous | Attribute | N/A |
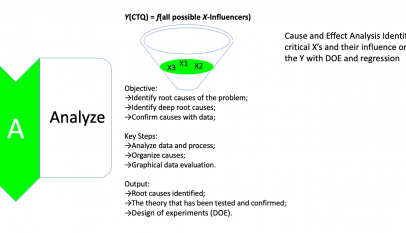
| Cause & Effect Diagram/ Fishbone | Brainstorming possible sources of variation for a particular effect | Potential sources of variation in gage r&r | Input ideas in the proper column heading for the main branches of the fishbone. Type effect in the pulldown window | All | All | N/A |
| Chi-Square (data summarised in table) | Determine if one set of defectives data is different than other sets of defectives data. | Compare DPMOs of Product Quality Complaints between 1210’s and 1208’s | Input two columns; one contains the number of non-defective, and the other contains the number of defective ones | Attribute | Attribute | At least one group is statistically different. |
| Chi-Square (raw data) | Determine if one set of defectives data is different than other sets of defectives data. | Compare DPMOs of Product Quality Complaints between 1210’s and 1208’s | Input two columns; one contains the number of non-defective, and the other contains the number of defective | Attribute | Attribute | At least one group is statistically different. |
| Dot Plot | Quick graphical comparison of two or more processes’ variation or spread | Compare the length of service of employees by country | Input multiple columns of data of equal length | Variable or Continuous | Attribute | N/A |
| General Linear Models | Determine if the difference in categorical data between groups is real when taking into account other variables x’s | Determine if height and weight are significant variables between two groups when looking at pay | Response data must be stacked in one column, and the individual points must be tagged in another column. Other variables must be stacked in separate columns. | Variable or Continuous | Attribute/ Variable | At least one data group is different from at least one other group. |
| Histogram | View the data distribution (spread, mean, mode, outliers, etc.) | View the distribution of Y | Input one column of data | Variable or Continuous | Attribute | N/A |
| Test for Equal Variances | Determine if the variation in one group of data is different than the variation in other (multiple) groups of data | Compare the variation between teams of operators | Response data must be stacked in one column, and the individual points must be tagged in another column. | Variable or Continuous | Attribute | (Use Levene’s Test) At least one group of data is different than at least one other group [1] |
| Kruskal-Wallis Test | Determine if the medians of non-normal data are different | Compare the medians of cycle time for different delivery methods | Response data must be stacked in one column, and the individual points must be tagged in another column. | Variable or Continuous | Attribute | At least one median is different |
| Mood´s Median Test | Determine if the medians of non-normal data are different | Compare the medians of cycle time for different delivery methods | Response data must be stacked in one column, and the individual points must be tagged in another column. | Variable or Continuous | Attribute | At least one median is different |
| Multi Vari Analysis (See also Run Chart / Time Series Plot) | It helps identify the most important types or families of variation | Compare within the piece, piece to piece or time to time of conditioning pallets | Response data must be stacked in one column, and the individual points must be tagged in another column in time order. | Variable or Continuous | Attribute | N/A |
| Notched Box Plot | Compare the median of a given confidence interval and variation between groups of data | Compare different nail drilling patterns to see if the median and spread of the diameters are the same | Response data must be stacked in one column, and the individual points must be tagged in another column. | Variable or Continuous | Attribute | N/A |
| One-sample t-test | Determine if the average of a group of data is statistically equal to a specific target | The manufacturer claims the average number of cookies in one lb. package is 250. You sample 10 packages and find that the average is 235. Use this test to disprove the manufacturer’s claim | Input one column of data | Variable or Continuous | N/A | Not equal |
| Pareto | Compare how frequently different causes occur | Determine which defect occurs the most often for overall customer complaints | Input two columns of equal length | Variable or Continuous | Attribute | N/A |
| Process Mapping | Create a visual aid for each step in the process being evaluated | Map Service Center area with all rework loops and inspection points | Use rectangles for process steps and diamonds for decision points | N/A | N/A | N/A |
| Regression | Determine if a group of data incrementally changes with another group | Determine if a conditioning output changes with the temperature in the building | Input two columns of equal length | Variable or Continuous | Variable or Continuous | A correlation is detected |
| Run Chart/Time Series Plot | Look for trends, outliers, oscillations, etc. | Determine if a conditioning output changes with temperature in the building over time | Input one column of data. You must also input a subgroup size (1 will show all points) | Variable or Continuous | N/A | N/A |
| Scatter Plot | Look for correlations between groups of variable data | Determine if the output of Service Centers is different | Input two or more groups of data of equal length | Variable or Continuous | Variable or Continuous | N/A |
| Two-sample t-test | Determine if the average of one group of data is greater than (or less than) the average of another group of data | Determine if the average delivery time of a transporter is different from another | Input two columns of equal length | Variable or Continuous | Variable or Continuous | There is a difference in the means |


Would like to be updated
Thank you for the comment! We would be happy to provide any updates or additional information on the topic you’re interested in. Please let us know if there is a particular area or aspect of Lean Six Sigma tools that you would like me to focus on, and we’ll do our best to provide you with the latest and most relevant information.