MAKIGAMI procedure
Key point Key point. Make workflows visible!
The above table indicates the sequence for preparing a MAKIGAMI analysis. Although MAKIGAMI analysis should of course expose losses in the work itself, a more important task is to uncover losses that obstruct the flow of work. For this reason, the MAKIGAMI analysis must be prepared in a way that renders the flow of work visible.
The aims of MAKIGAMI analysis are as follows.
- Promote transparency of administrative processes based on the concept of “office factory”.
- Analyze inter-process flows and in-process work that have been made transparent.
- Mutually confirm facts through the participation of all workers and quantify problems.
- Promote KAIZEN that is realistic and inventively matches the situation.
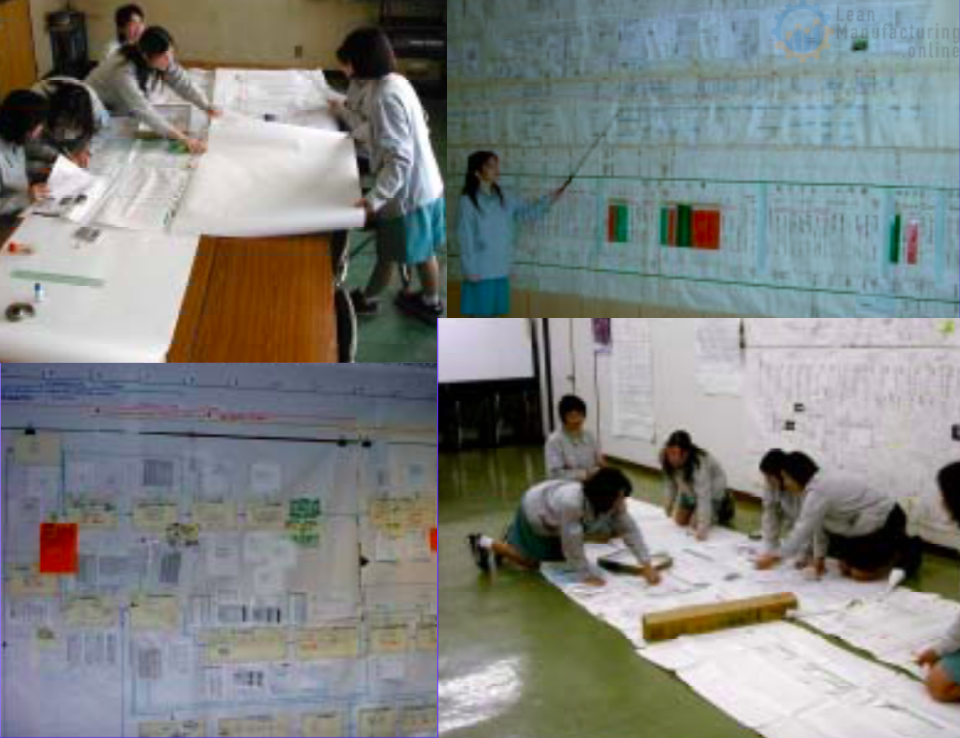
1. Define order time-based MAKIGAMI as ”MAKIGAMI part 1”. Then to make workflow visible, sort out the order based on the process and make “MAKIGAMI part 2”

2. Uncover factors that obstruct the workflow (fill in mini-memos and then stick them on MAKIGAMI).
Step 3 Extraction of problems and classification of losses by layer
The MAKIGAMI analysis prepared in Step 2 made the content of the work visible. However, a clearer picture of the workflow can be obtained by preparing a MAKIGAMI analysis (part 2) that incorporates the idea of “processes,” based on the concept of the “office factory.”
The diagram above illustrates the format of a MAKIGAMI part 2 analysis, but this is only a sample format and need not be followed to the letter.
There are other methods such as adding the idea of “processes” to the MAKIGAMI analysis performed in part 1, to make the workflow easier to understand.
Examples of MAKIGAMI
Categories of losses and their definitions
Before identifying the factors that obstruct workflow, it is a good idea to establish a common understanding with the members of your group regarding what the desired, or ideal, state of that workflow should be. You are then in a position to compare the current (actual) state of affairs with the desired state and identify the difference between the two as a loss.
In doing so, it is important to determine beforehand the categories of losses and their definitions.
The table above offers an example of how losses can be categorized. Rather than follow this example too strictly, however, you are advised to discuss the categories fully with your fellow members, so that losses can be sought out as freely as possible. For example, you can implement a “mini memo operation” and encourage members to write a large number of these and append them to the MAKIGAMI analysis, bearing in mind that quantity is more important than quality.
Work analysis Graphs
Identify the Point at issue & Classify the Losses

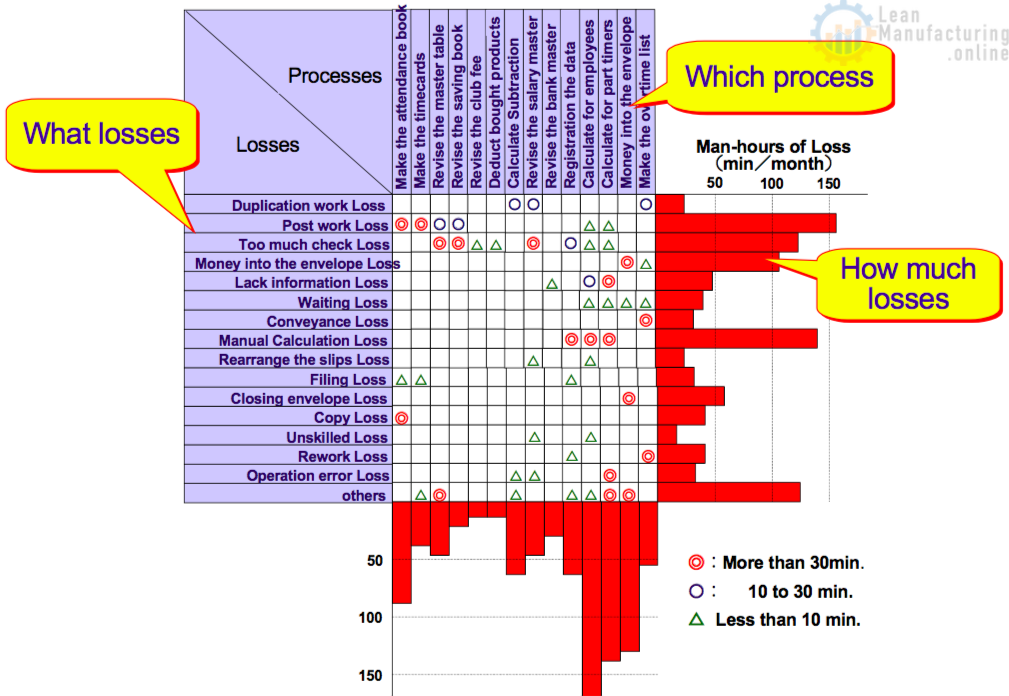
Organize the mini-memos by category to perform loss analysis, then display the results in a Pareto diagram or graph.
Clarified Loss Graphs
Make the plan to improve and implement
|
Share the direction of KAIZEN among members and set points of view to KAIZEN
|
|
Clarify the relationship between losses and processes and then list up the KAIZEN themes. |
|
Break KAIZEN themes down into small pieces such as creating sub-themes |
|
Divide themes into type A (can be solved by one’s own workplace), type B (can be solved in cooperation with other divisions), and C (must be addressed on a company-wide basis). Then implement KAIZEN with a certain target deadline. |
The table of KAIZEN theme list

Step 4 Planning and Implementing Improvement
The Clarified Ross Graph in the previous section makes key information easily understandable at a glance, such as which processes losses occur in, what losses occur, and how severe the losses are. This graph is useful in determining the orientation for improvement efforts and assigning orders of precedence.
In listing themes, it is important to:
- Discuss all issues thoroughly with other members, to determine items of key interest for improvement.
- Create sub-themes, whose results can be seen within two to three months.
- Divide themes into type A (can be solved by one’s own workplace), type B (can be solved in cooperation with other divisions), and C (must be addressed on a company-wide basis).
In considering each of the above, discuss the themes with the people responsible to determine deadlines for achieving each, implementing them in order from A to C. Also, it is important to see if you can convert B themes into A and C themes into B.
Monitoring results
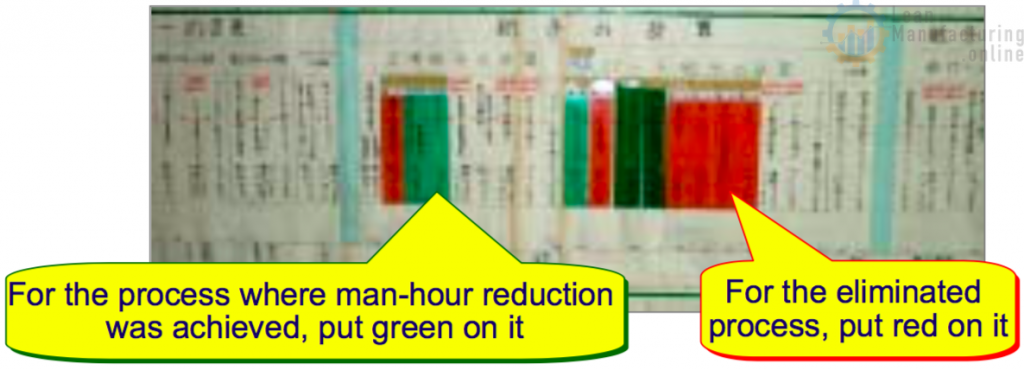
1. Separate the completed process by color
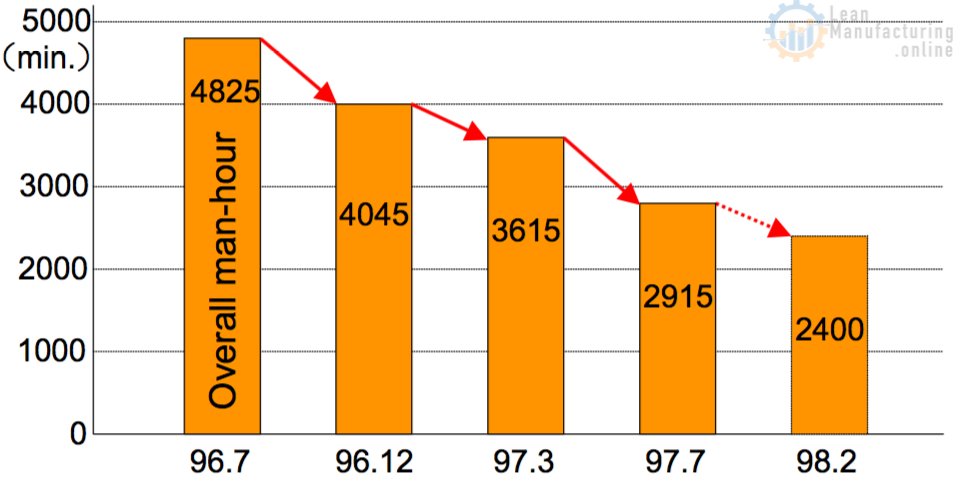
2. Monitor results of Kaizen by making graphs
Step 5 Monitoring results and sustaining
Fortunately, there is a way of marking the results of improvements in the MAKIGAMI analysis in a way that can be easily and speedily understood by anyone. As shown in the sample photo above, green and red transparent paper can be used to indicate processes that have been eliminated in red and processes in which man-hours have been reduced in green.
Be sure to design graphs so that results can be easily assessed in quantitative terms.
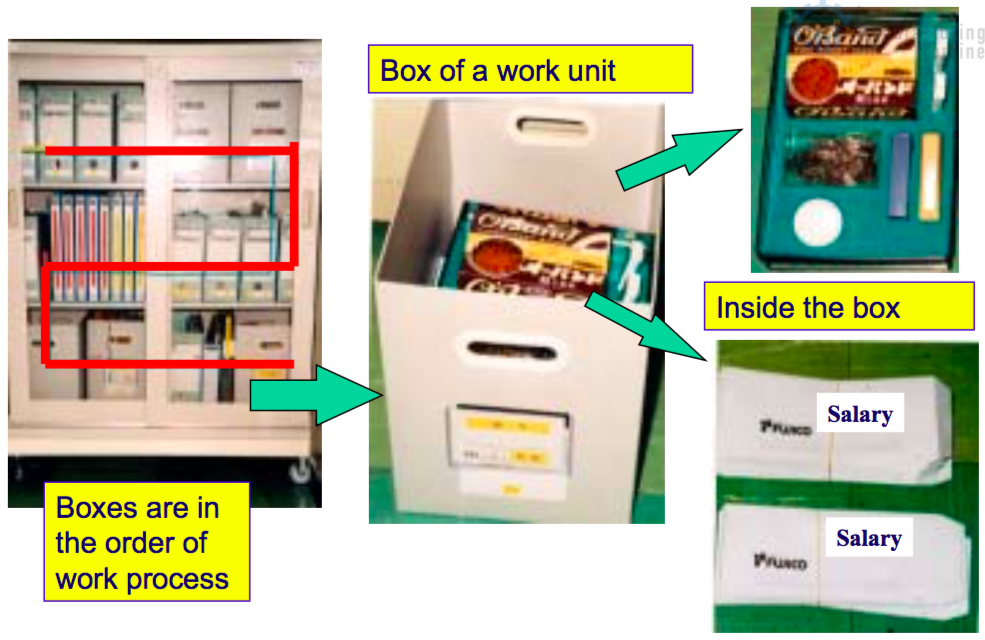
An Example of Salary Calculation Job Workstation

Relying on the capabilities and attention of operators is not sufficient to ensure that the results of improvements become entrenched in the workplace without backsliding. The photo above shows an example of some of the physical tools devised for use in support management. The use of such tools is the beginning of the development of a true workstation.
Making Order of Work-station
Key point Manage the flow based on the actual work!
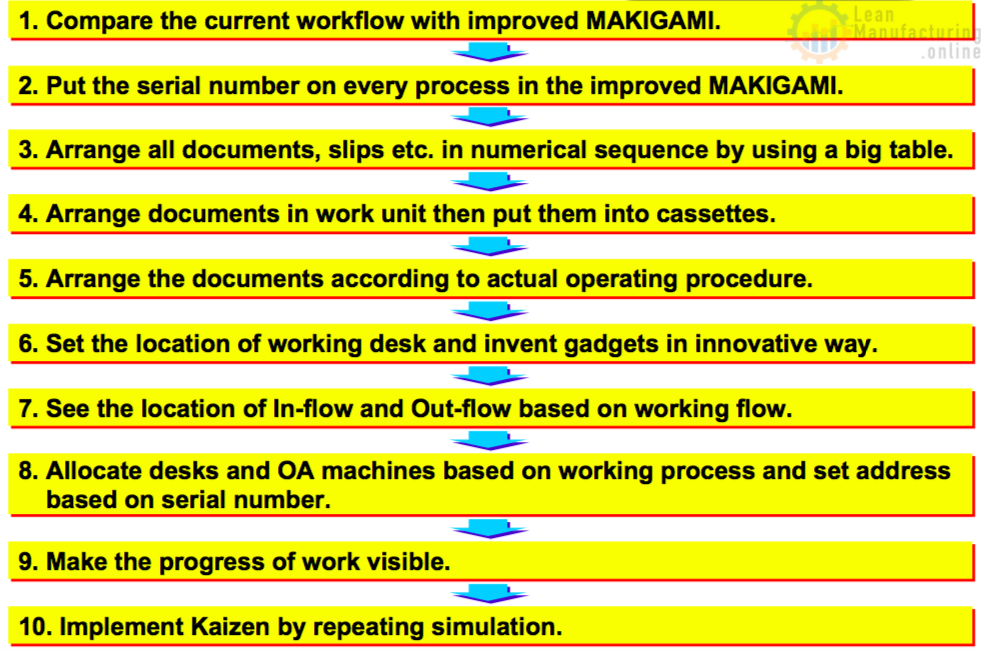
The Layout on the Desk
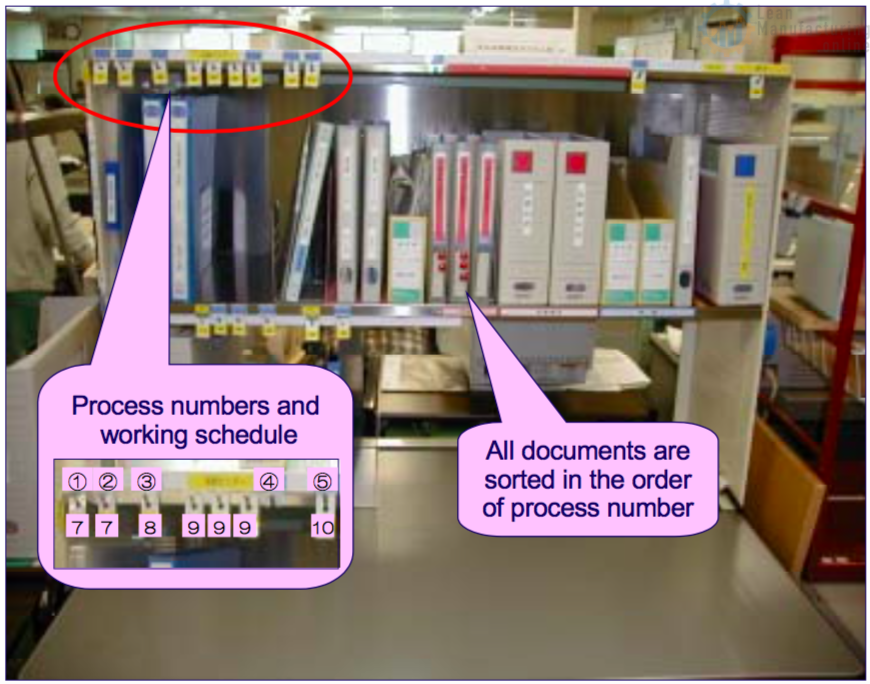
Desk Layout
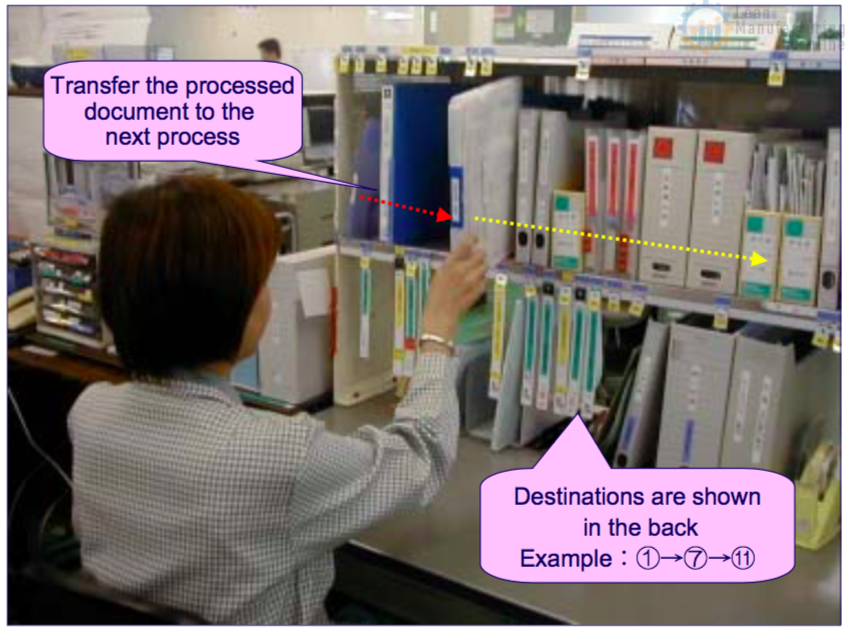
Visualisation of progress
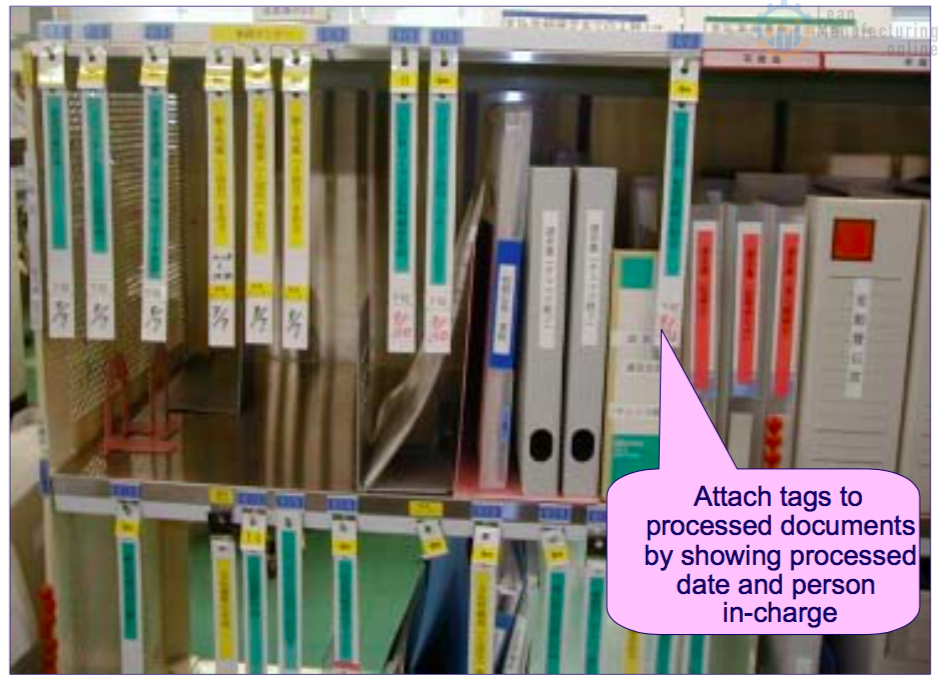
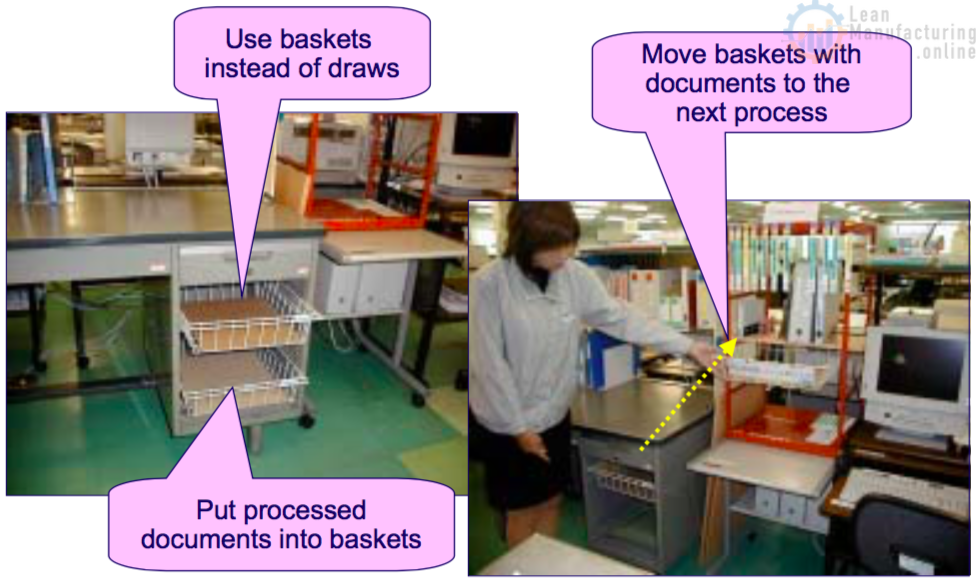
KAIZEN of Clerical Desks
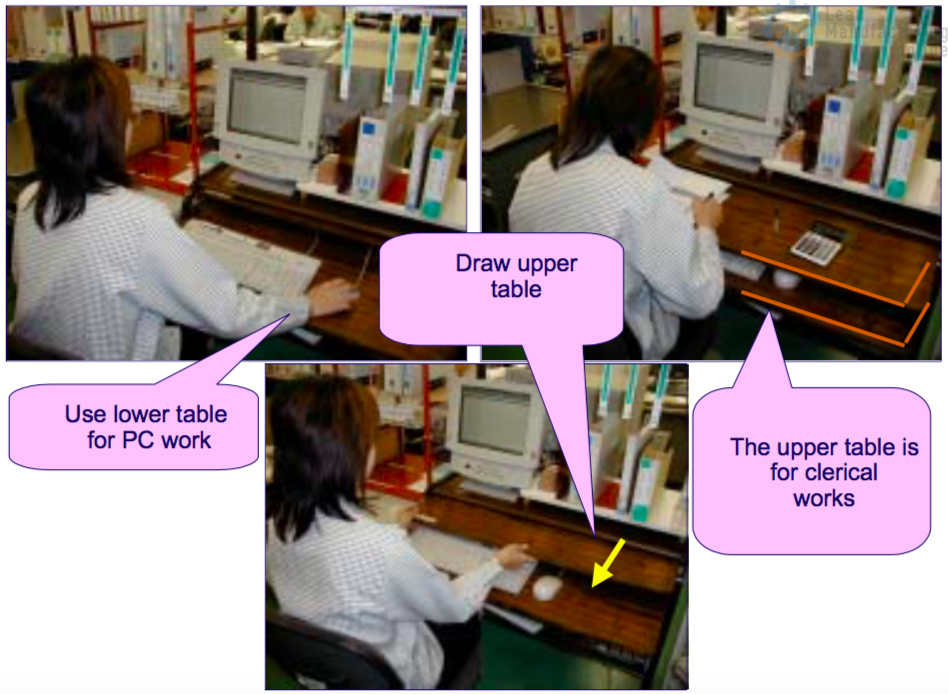
PC Desk KAIZEN with two table
Workstation
Layout working desks and OA facilities according to the job flow

Display job-name plates according to the serial number
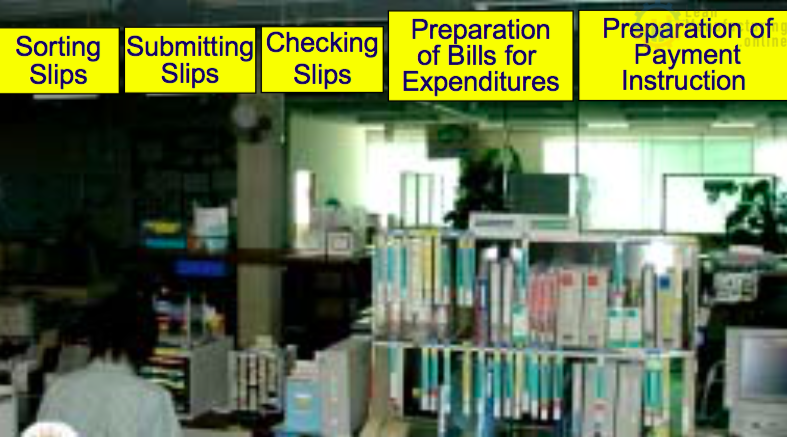
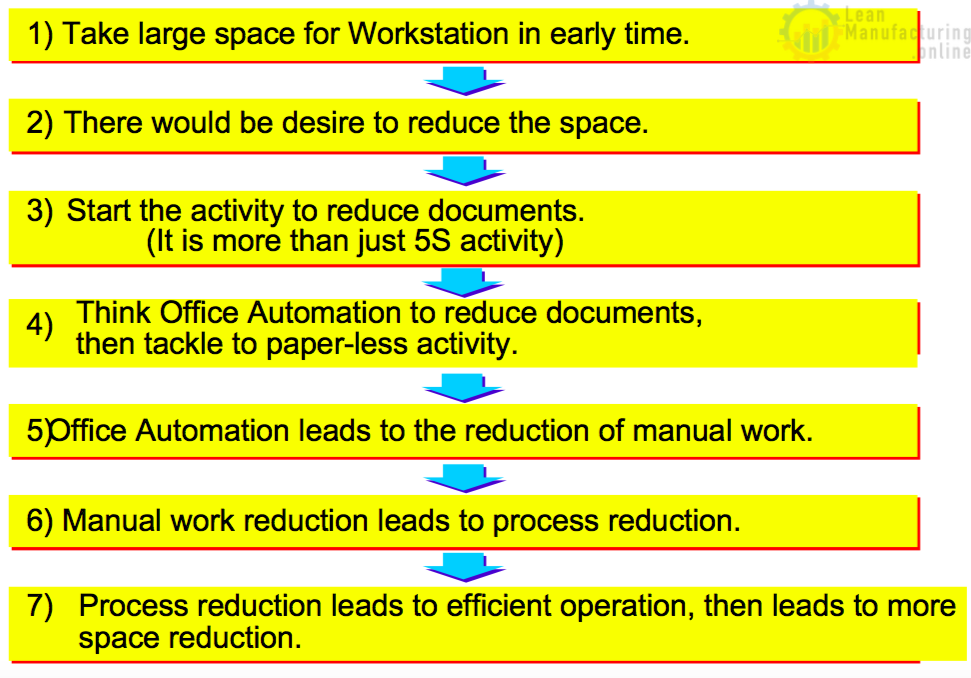
Evolution of the work station
Toward Greater Management Efficiency

To be truly effective in making operations more efficient, themes are needed that concern not just one division but multiple divisions. The diagram above illustrates the workflow in production management from order acknowledgment to shipping. A look at the entire workflow shows that every segment of the enterprise is involved. The processes described are long and complex.
A single MAKIGAMI analysis able to detail a complex case such as this would have to be enormous and unwieldy. It would be difficult to comprehend at a glance and would therefore defeat its purpose of rendering losses easily visible.
One solution is to combine a flowchart such as the above with several MAKIGAMI analyses (eight, in the example above). This approach enables the workflow to be analyzed in great detail.
In the case of the administrative division, very few problems can be resolved internally. In many issues, one’s own division may encounter no problems, yet abnormalities may well occur in another. The path toward greater efficiency lies in taking a holistic view of operations, switching one’s sights from sub-optimization to overall optimization.
Effect of MAKIGAMI
Example of Daily Settlement Activities
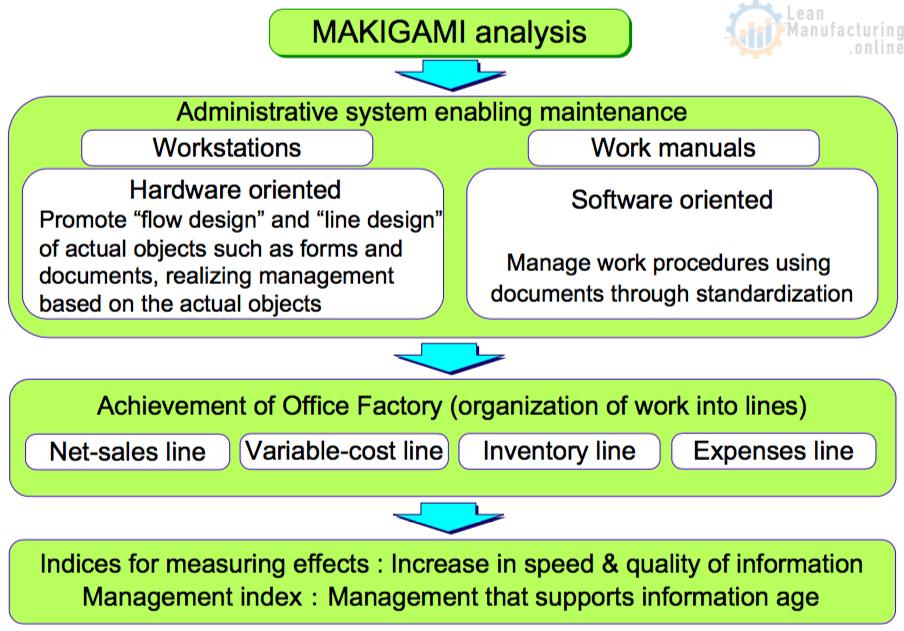
The example of daily settlement activities above illustrates this approach. First, a MAKIGAMI analysis is conducted to assess and improve the actual status of the enterprise. Support management is provided through the creation of workstations and work manuals.
The next step is to create the necessary lines for carrying out a daily settlement following the concept of the “office factory.” When these lines are functioning, the administrative division experiences a quantum leap in the speed and quality of information, as it creates a management constitution with the strength to answer the challenges of the information age.
MAKIGAMI analysis achieves greater operating efficiency not merely by reducing the eight major losses in administrative work, but by contributing significantly and positively to management.


