Background & Objective
- The purpose of this manual is to provide uniform and consistent guidelines for calculating manufacturing performance for CPG production
- The main objective is to provide a common framework that will facilitate the implementation of TPM based metrics.
- The intent of this presentation is to define the major drivers of packaging and process performance improvement.
- Equipment Utilization based on 7 days x 24 hours availability
- Asset ( Capacity ) Utilization
- OEE: Overall Equipment Effectiveness
- OPE: Overall Production Effectiveness
- Note: For all practical purposes a packaging line includes incoming packaging/case conveying all the way through palletizer.
Equipment Utilization
Fundamental Premise – All equipment is available to be run 7 X 24

Unscheduled Time
- Is the time the equipment is available to run more production. This measures how much more output is available from the current assets if needed today
- Holidays
- Mid-Week idle time
- Weekends
- Rate is reduced due to lack of scheduled demand
Scheduled Downtime
- Is the time allocated to scheduled activities on the equipment
- Planned Maintenance / Shutdowns
- Meetings / Training / Breaks
- Trials
- Planned Cleaning
7 Major Losses
- Breakdowns
- Major Stoppages
- Change Overs
- Cutting Blade
- Start Up / Shut Down
- Performance Losses
- Minor Stoppages
- Speed Losses
- Defects
- Quality Losses
Running Time
- Is the time that is left
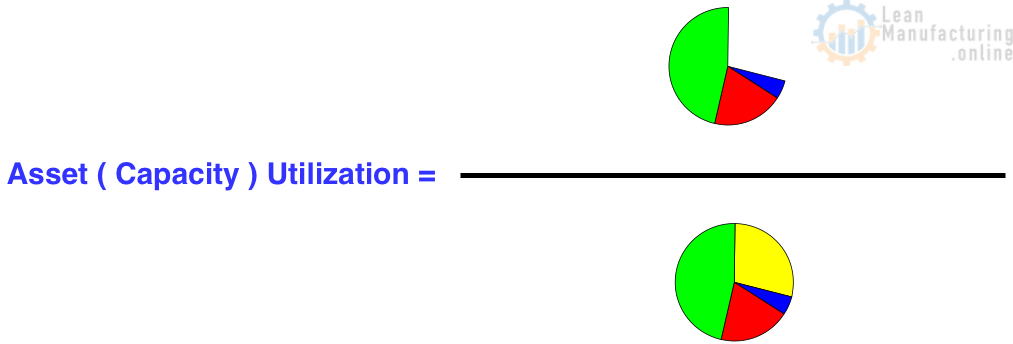
Asset ( Capacity ) Utilization
- This defines how effective an asset is being utilized
- The inverse reveals how much more output is available from the current asset if needed today.
- Graphically Presented :
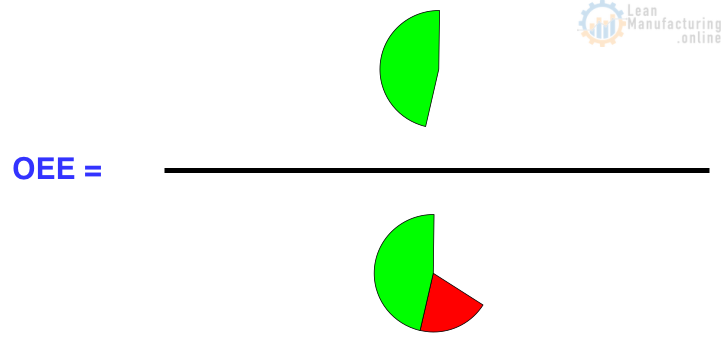
OEE – Overall Equipment Effectiveness
- This measures the ability to run equipment at the designed speed with zero defects
- In order to maximize OEE one must reduce the 7 major losses to zero
- Graphically Presented :
OPE – Overall Production Effectiveness
- This measures how well the supply chain is effectively utilizing manufacturing assets
- In addition to the 7 major losses, OPE considers planed downtime and unscheduled time as supply chain losses.
- Graphically Presented :

7 Major Losses
- Each site will have to develop recording and tracking methods for the various losses
- Graphically Presented :

Minor Stoppages
- These are all stoppages less than 10 minutes
- For example – equipment jams
- Minor stoppages, although short in duration, are often a significant total loss when summed up
- Minor stops highlight the area of operator frustration and increasing trends can identify deterioration of the equipment
- The actual # of minor stoppages are to be recorded and we will back into the minor stoppage time.
- We must be very accurate in capturing the time for the other equipment losses!
Major Stoppages
- These are all stoppages 10 minutes or greater
- Equipment Failures – Are failures due to
- Electrical
- Mechanical
- Other Failures
- Stoppages due to packaging defects
- Supplier related downtime
- Warehouse downtime
- Equipment Failures – Are failures due to
- For each major stoppage, each individual event should be recorded and the duration
- The stoppage time is the total time from the equipment stopping, until it starts again.
- These stoppages should be grouped into Equipment and Other failures.
- Equipment failures are stoppages resulting from equipment deterioration.
- It is the principal responsibility of planned maintenance to eliminate Equipment Failures.
- Over time, effective planned maintenance will reduce the mean time between failures (MTBF).
- Graphically presented:
- The ramp down and ramp up will be captured in the minor stoppage time.
Changeovers
- Changeovers are defined as any “change process” that needs to be managed on the production floor.
- Changeovers include size changeovers, washouts, deal changes, line sanitizations, etc.
- Changeovers are considered to be non-value added because they contribute a significant amount of lost time that should be available for running more demand.
- There are two fundamental operating philosophies in HPC NA around change overs:
- A Running Changeover ( R-C/O) – situations where you Run – Changes Over – Run Immediately after the change.
- A Non-Running Changeover ( NR-C/O) – situations where you Run – Change Over / Down – Run when scheduled to produce again.
- Unlike other losses Changeovers includes both “stop” time to complete the change over, but also the time required to “ramp up”.
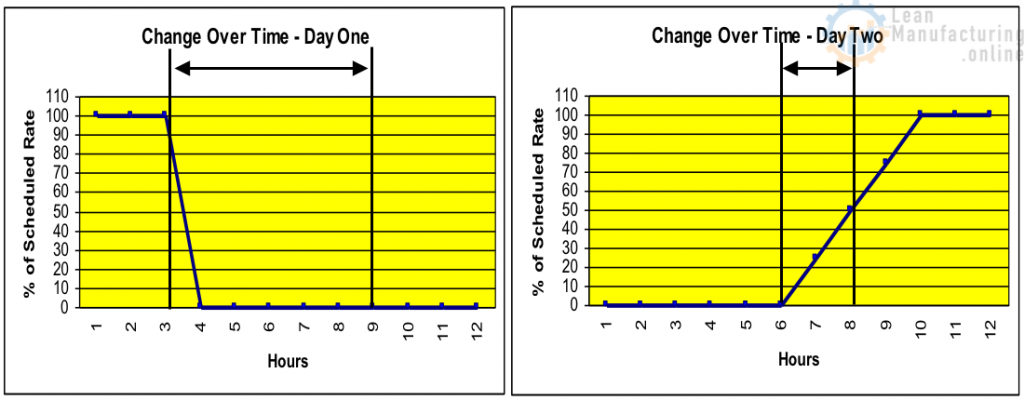
“Running” Changeovers
- The running change over time begins when the line is shut down to start the change and ends when the line is re-started and the hourly case count has reached 50% of its scheduled rate.
- Graphically presented:

“Non – Running” Changeovers
- The non-running changeover time begins when the line is shut down to start the change, stops when the labor has physically changed the line, and begins again when the line is re-started and stops when the hourly case count has reached 50% of its scheduled rate.
- Non Running Changeovers Time Graphically Presented:
- For any given month the change over loss will be composed of : R-C/Os and NR-C/Os.
- Consistency of applied manpower on a non running change over is very critical!
Quality ( Defect ) Losses
- Quality Losses occur when equipment is used to produce product, which is not immediately available for distribution.
- All product which is not immediately released for distribution is considered a loss, because of the delay created in the supply chain.
- Often some of the material can be release after inspection, but this increases inventory costs and reduces customer service.
- Quality Losses are normally calculated.
- The quantity of material initially held divided by the design rate produces the equipment time used to generate Quality Losses.
- Example:
- Initial Hold 2300 units
- Design Speed 100 units
- Quality Loss 23 min.
- Example:
Start up and Shut down Losses
- These losses occur when equipment has been shut down. Often there are delays in equipment or manpower preventing immediate resumption of production.
- Examples include:
- Start up after annual shutdown
- Start up after holidays or weekends
- Start up after lunches and breaks
- Startup losses include the “ramp up time”. Therefore, the time required to achieve 50% of the design rate. This is measured in the same way as Changeovers.
- If the break or other scheduled event exceeds the scheduled down time the excess time is considered part of the Shutdown Loss.
Cutting Blade Loss
- Cutting blade loss captures the time lost in replacing routine wear items. Only the “stop” time is recorded.
- TPM stresses improving the wear components to significantly increase life.
- This is a major loss in the manufacturing of Q-tips, however, may be as less significant in other categories.
Speed Loss – Packaging
äSpeed Loss is the lost equipment capacity resulting from operation at reduced speed. It is important to for operators to record the actual operating speed to ensure this loss can be assessed accurately.
- Example:
- Design Speed 100 Units/min
- Actual Speed 80 Units/min (Shift Average)
- Speed Ratio = Actual Speed/Design Speed = .80
- Speed Loss Factor = 1 – Speed Ratio = .20
Speed (Rate) Loss – Process
- A rate loss occurs when there may be a partial blockage in the line when running at designed rate.
- Example:
- Design Speed 50,000 lbs/hr
- Actual Speed 35,000 lbs/hr (Shift Average)
- Speed Ratio = Actual Speed/Design Speed = .70
- Speed Loss Factor = 1 – Speed Ratio = .30
Computing Speed Loss Time and Minor Stoppage Time
- Typically, minor stoppage time and speed loss time are combined in a single, final “bucket” since we do not capture lost time on the packaging floor.
- The calculation below details the steps to take in order to compute the time lost on reduced speed and minor stoppages.
- It begins with the principle that lines should run at their designed speed.
- Re-call, that we do not capture the loss time for speed and minor stoppages.
- Once all losses are known, the TPM indicators become a very simple calculation.
- Example
- Available Time: 8 hours
- Actual Production: 1100 Units
- Designed Speed: 300 Units/hr
- Actual Speed: 250 Units/hr
- Losses accounted for:
- Change Over = 1 hr
- S/U & S/D = .5 hr
- Major Stoppages = 1 hr
- Quality = .5 hr
- Step 1. Subtract the known losses from the available time
- 8 – 1 – .5 –1 – .5 = 5 hours of Remaining Time
- Step 2. Calculate Speed Loss assuming no minor stoppages.
- Speed Loss Factor ( SLF ) = 1 – 250 / 300 = .167
- Speed Loss Time = Remaining Time*SLF
- Speed Loss Time = 5*.167 = .83 hours
- Step 3. Calculate the total time for Speed Loss & Minor Stoppages.
- To produce 1100 Units at the design speed should have taken
- 1100 Units @ 300 Units / hour = 3.67 hours of Theoretical Production Time
- The difference between the Remaining Time and the Theoretical Production Time is the “Bucket Time” which consists of down time due to both speed reduction and minor stoppages.
- 5 hours of Remaining Time – 3.67 hours of Theoretical Production Time = 1.33 hours of Bucket Time
- With only minor stoppage time remaining, we have 1.33 hours of Bucket Time – 0.83 hours of speed loss = .5 hours of minor stoppage time.
- Reconcile the losses
- 8 hours available
- 1 hr for Changeovers
- l.5 hr for S/U & S/D
- 1 hr for Major Stoppages
- .5 hr for Quality
- .83 hr for Speed
- .50 hr for minor stoppages
- = 3.67 hours of Running time
- = 4.33 hour of Total losses
- Calculate OEE
- OEE = (Running Time) / ( Running Time + Major Losses )
- 3.67/( 3.67 + 4.33 )=45%


4M Analysis Process: Root Cause Guide for Manufacturing
Learn how to use 4M Analysis to find manufacturing root causes across People, Machine, Method, and Material with diagrams, examples, and checklist.


Thanks for the pretty awesome explanation!! TPM and OEE processes are worth spending time and productive also. As a warehouse manager, focusing on TPM and minimizing downtime are definitely the key things on my list. A minimized machine downtime helps in increasing the overall equipment effectiveness(OEE). So I suggest that one should use good downtime tracking software like “Thrive” for their industry. Hope this information will help. Cheers!!