Tool that provides visualization and understanding of the flow of material and information as a product or service makes its way through the value stream and can be used to present both current state as well as future state vision.
Current State
It is a visual tool that shows all the actions (value added and non value added) currently required to bring a product through the process of delivering it to a customer.
Future State
The ultimate state where the individual processes are linked to their customers either by continuous flow or pull, and each process gets as close as possible to producing only what its customers need when they need it.
Mapping process
Choose product family and identify stream->Create “Current State”->Create”Future State”->Start Implementation Plan->Make changes based on the plan.
Who will create VSM?
- An end-to-end cross functional team approach is required
- Requires leadership and facilitation
- Team participants should representative of all areas involved in the order to cash cycle, such as:
- Manufacturing
- Finance, Accounting
- Design
- Operations
- Procurement
- Distribution and Logistic
- Accounting
- Customers (internal/external)
- Suppliers (internal/external)
- Quality
Selecting VSM
- A VSM needs to focus on one product family only
- A product family is a group of products that pass through similar processing steps and over common equipment
- Use Product Family Matrix to help select the family and value stream to focus on
- Select product families or services with high volumes or high costs and similar processing steps.
- Select value streams with low PCE (Process cycle efficiency) values
- Time IS money … Low PCE value is a good indicator of significant waste in the process, (i.e. additional resources, handling, equipment, space, obsolescence, scrap, rework, information shortages, damage and shrinkage, etc)
How to create VSM
• Review entire value stream (flow) with project team – establish consensus and familiarity with “flow” and steps • Gather information starting from furthest downstream point such as shipping, working your way upstream. Use a pencil and paper, sketch as you walk.This is a rough sketch, clean it up later. • Collect data. Do not rely on standard times or information that you do not personally obtain ( exceptions may be reliable data collected by automated systems). • Map (brown paper, Post-It™) the value stream yourself with the input of your team. You must understand the whole.
• Start with the customer requirements • Use the customer icon to represent the customer in the upper right hand portion of the page. Using a “data box” beneath the icon, record the customer’s requirements (CTQ’s, frequency, etc) • Draw the basic production or service processes in the lower half of the page using process boxes, from lento right (similar to SIPOC). • Include data boxes under each process box, recording data relevant to the purpose of your value stream map: cycle time, changeover time or delays/waits between process boxes. Include the number of people required to operate the process, touch time and frequency, etc.
• Use the triangle icon to illustrate where inventory accumulates and how much. • Use a transportation icon and arrow to indicate movement of finished goods to the customer, as well as materials coming from suppliers. • Indicate delivery frequency and size of delivery, and identify raw material inventory or finished good storage using the inventory triangle. • If a scheduling or planning/forecasting (MRP) system is used, identify this on the upper center portion of the page.
• Use the upper half of the page to draw information flow. Capture the steps of information flow and exchange as discrete activities, and use (electronic) arrows to indicate direction of flow. • If scheduling or production control is used, draw information flow from Production Control to all internal departments including shipping. • Use striped arrows to show material movements that are pushed by the producer, not pulled by the internal and /or external customer.
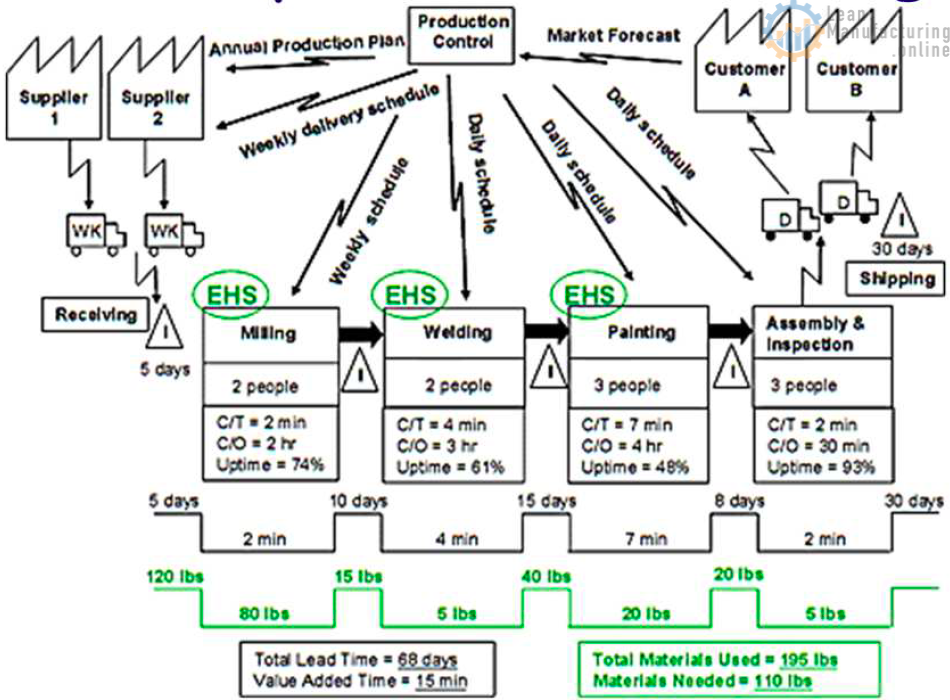
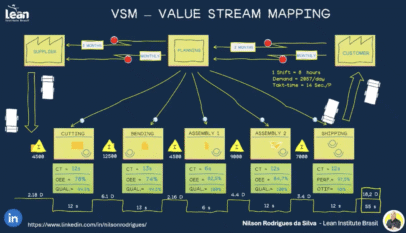
Value Stream Map Manufacturing Example


4M Analysis Process: Root Cause Guide for Manufacturing
Learn how to use 4M Analysis to find manufacturing root causes across People, Machine, Method, and Material with diagrams, examples, and checklist.


Training on Business excellence practices. I am retired technologist. Trying to improve myslef in this field.
Excellent learning material.