Significance and Basic Definitions
Every time someone makes a decision, it is critical that the decision-maker select the same choice again and that others reach the same conclusion. Attribute agreement analysis measures whether or not several people making a judgment or assessment of the same item would have a high level of agreement among themselves by evaluating the repeatability, reproducibility, and overall accuracy of the appraisers.
This type of analysis can be applied to discrete (nominal or ordinal) data:
- Nominal data assigns names to each data point without placing them in order (i.e. Pass, Fail)
- Ordinal data groups data according to some ranking system (i.e. scale of 1 to 10).
Benefits of an Attribute Agreement Analysis:
- It helps to characterize the quality of the data
- Determines the area of non-agreement
- Allows for calibrating appraisers, judges, or assessors for a higher level of agreement
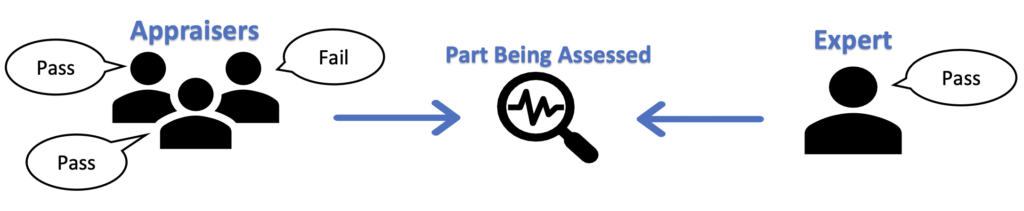
Appraiser – The person who is making the decision.
Expert – The main SME that creates the standard to compare the appraisers’ answers to (optional).
Repeatability – Variation in the assessment when repeated on the same part by the same operator.
Reproducibility – Variation in the assessment when repeated on the same part by a different operator.
Excel Set-Up
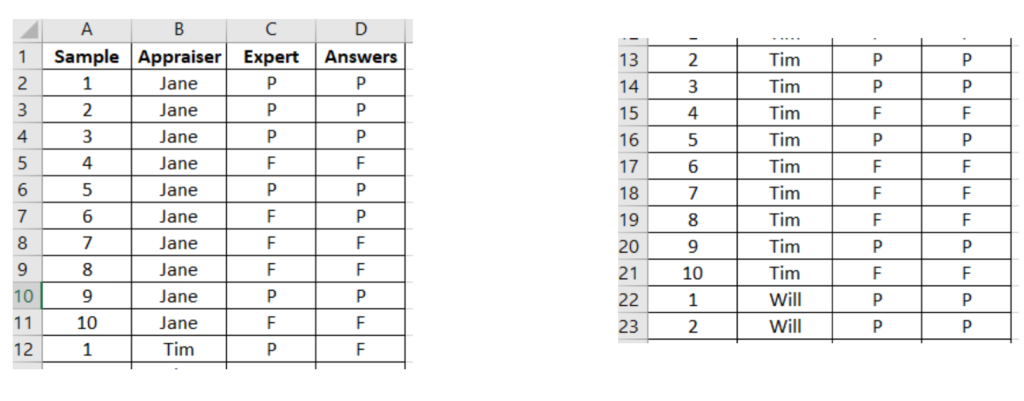
ProcessMA is very particular about how the data is entered. Be sure that column labels are in row 1 and data begins in row 2. Also, ensure that there is no data below the table (i.e. sum or average).
1) Create columns for the sample, appraiser, result, and standard (optional).
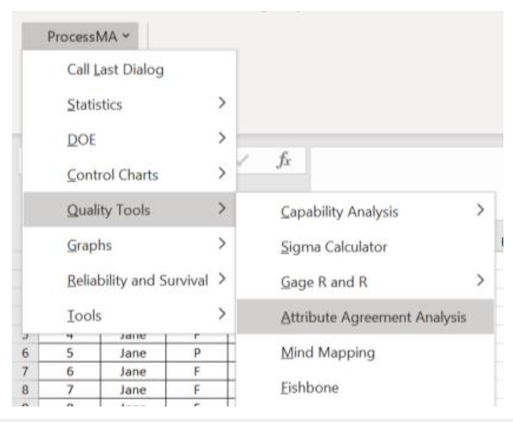
2) Navigate to “Add-Ins” – “ProcessMA” – “Quality Tools” – “Attribute Agreement Analysis.”
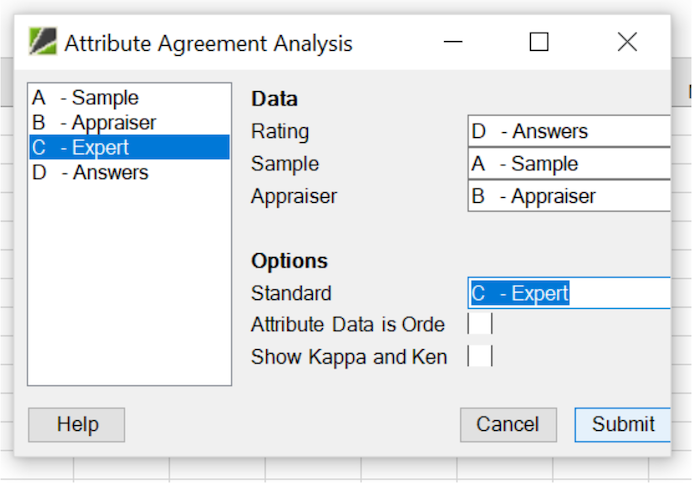
3) Select the data for Rating, Sample, and Appraiser by double-clicking on the lettered options from the column headers. Select the data for standard if it is available. Press “Submit.” The Attribute Agreement Analysis will open in a new tab.
Results and Interpretation
The result of the Attribute Agreement Analysis will appear in the following format with several components, each conveying different types of information. The components include:
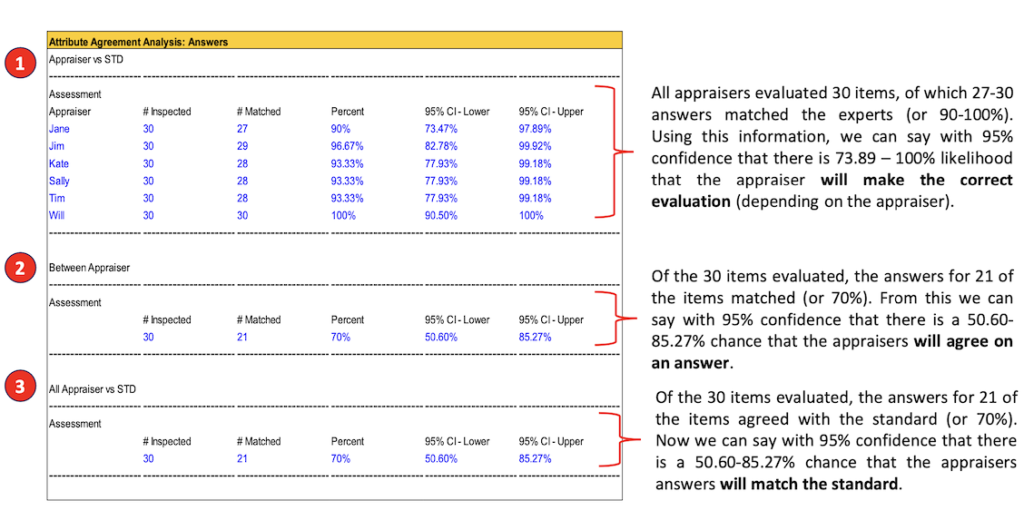
For all components, it is desirable to have the percent and the upper and lower limits be as close to 100% as possible. The upper and lower limits dictate the likelihood for each category based on a 95% confidence interval. The acceptable lower limit or percentage would be dictated based on the situation and the risks associated with the appraisers making the incorrect conclusion.
- Appraiser vs STD: Because there is a known standard for each sample, you can evaluate the accuracy and consistency of each of the appraiser’s ratings.
- Between Appraisers: This shows the number of samples that appraisers all agree on. of all the appraisers’ ratings.
- All Appraisers vs STD: Because there is a known standard for each sample, you can evaluate the accuracy
After identifying where the measurement system is weak, one option is to make do with what you have and manage the risk, and the other is to take appropriate action:
- Implement training for appraisers
- Design visual aids to assist with the appraisal process
- Explore options for measurement ‘tools’ that would permit less subjective assessments


4M Analysis Process: Root Cause Guide for Manufacturing
Learn how to use 4M Analysis to find manufacturing root causes across People, Machine, Method, and Material with diagrams, examples, and checklist.


