Learning Objectives
- Prepare plans to collect output, process and input data
- Construct forms and test data collection procedures
- Refine data collection Implement data collection plan
Activities
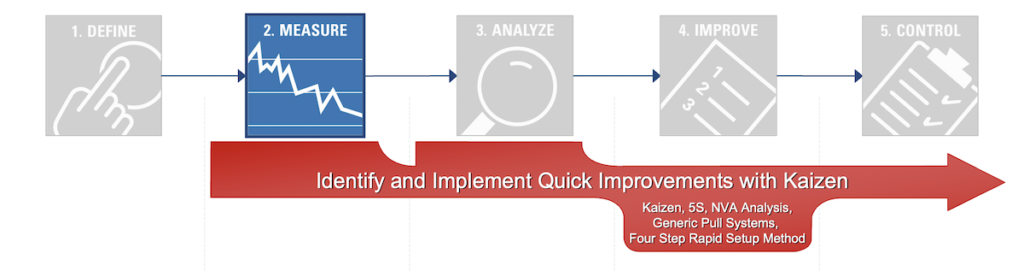
- Value Stream Map for Deeper Understanding and Focus
- Identify Key Input, Process and Output Metrics
- Develop Operational Definitions
- Develop Data Collection
- Plan Validate Measurement System
- Collect Baseline Data
- Determine Process Capability
- Complete Measure Gate
Tools
- Value Stream Mapping Value of Speed (Process Cycle Efficiency / Little’s Law)
- Operational Definitions
- Data Collection Plan
- Statistical Sampling Measurement System Analysis (MSA)
- Gage R&R
- Kappa Studies
- Control Charts
- Histograms
- Normality Test
- Process Capability Analysis
Develop Data Collection Plan
Types of Data
Decisions on sampling and data display tools will be influenced a lot by the type of data you are gathering. Of these two types, Continuous and Attribute, Continuous requires smaller sample sizes (and usually offers more options for analysis).
Attribute data, however, is very often the most important to a service process.
Continuous – Any variable measured on a continuum or scale that can be infinitely divided. Primary types include time, dollars, size, weight, temperature, and speed. These types are preferable over Discrete/Attribute Data.
- Continuous lead time
- Cost or price
- Length of call temperature of rooms
Discrete or Attribute – A count, proportion or percentage of a characteristic or category. Service process data is often discrete.
Let’s see how we can develop Data Measurement Plan
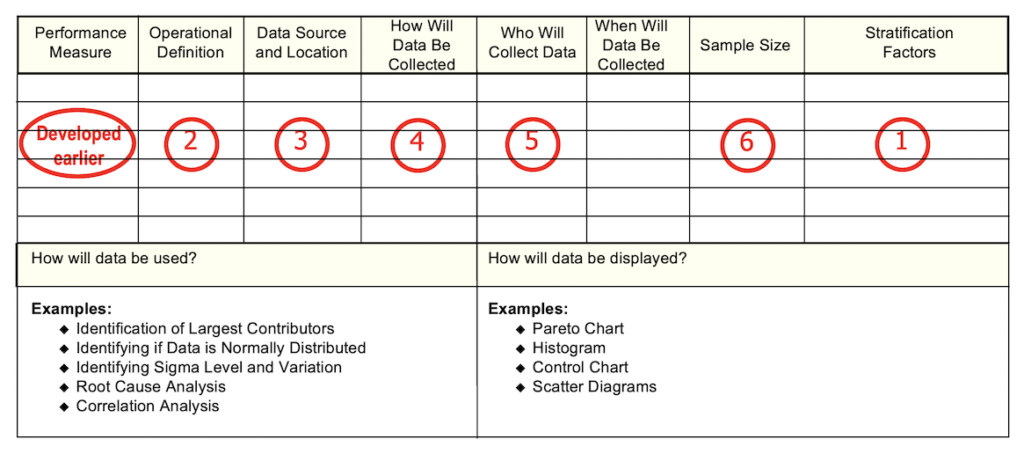
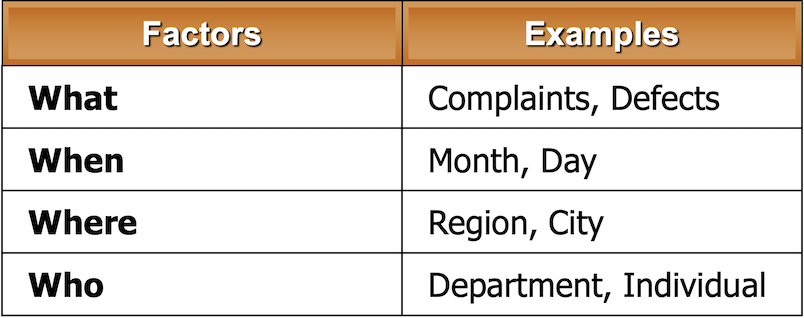
1. Stratification Factors
What are the ways you need to look at the data?
- Data Stratification – Capturing and use of characteristics to sort data into different categories (also known as “slicing the data”)
- Focuses on the Process Outputs, the Y’s Used to:
- Provide clues to root causes (Analyze)
- Verify suspected root causes (Analyze)
- Uncover times, places where problems are severe (“vital few”)
- Surface suspicious patterns to investigate
If you don’t collect stratification factors “up front,” you may have to start all over later. On the other hand, seeking too many factors makes the data more complex and more costly to collect.
Stratification Matrix – A Tool for Stratification
Key Steps
- Fill in the Output measure Y.
- Fill in the vital stratification questions about the process in relation to the Y.
- List all the levels and ways to look at the data to determine specific areas of concern.
- Create precise measurements for each subgroup or stratification factor.
- Review each of the measurements (including the Y measure) and determine whether or not current data exists.
- Discuss with the team whether or not these measurements will help predict the output Y; if not, think of where to apply the measures to help you predict Y.
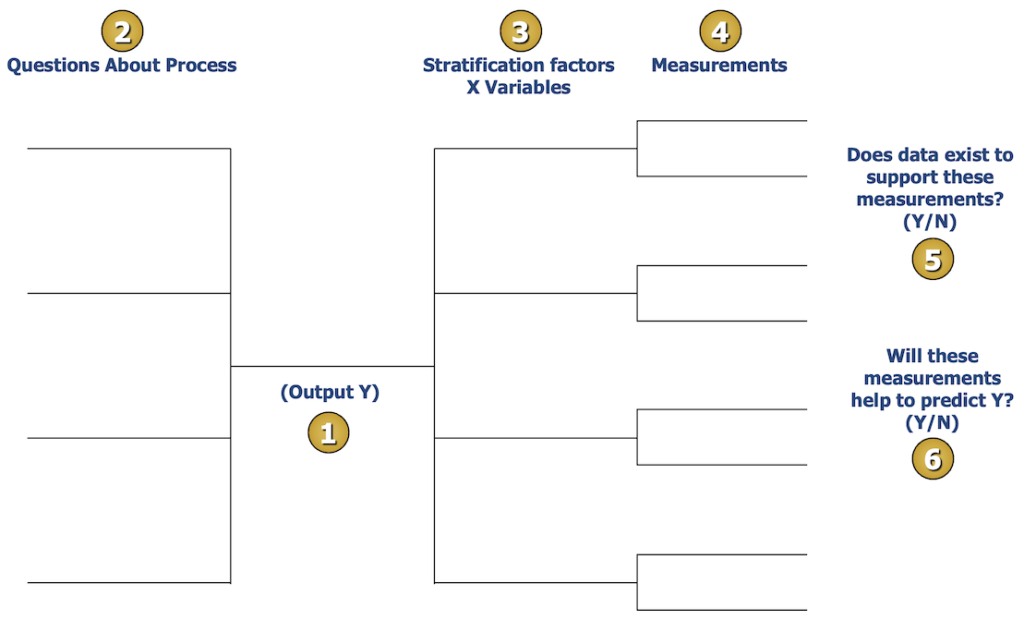
Stratification Matrix – An Example (Hotel Checkout)

2. Developing Operational Definitions
- Operational Definitions apply to many things we encounter every day. For example, all the measurement systems we use (feet/inches, weight, temperature) are based on standard definitions that we all know and accept. Sometimes these are called “standards.”
- Other times, our operational definitions are vaguer. For example, when someone says a loan is “closed,” they may mean papers have been sent but not signed; another person may mean signed but not funded; a third person might mean supported but not recorded.
- While here we are focused on operational definitions in the context of measurement, the concept applies equally well to “operationally defining” a customer requirement, a procedure, a regulation – or anything else that benefits from clear, unambiguous understanding.
- Learning to pay attention to and clarify operational definitions can be a significant side benefit of the Six Sigma process.
- What it is…
- A clear, precise description of the factor being measured
- Why it’s critical…
- So each individual “counts” things the same way
- So we can plan how to measure effectively
- To ensure common, consistent interpretation of results
- So we can operate with a clear understanding and with fewer surprises
The Steps. From General to Specific:
- Step 1 – Translate what you want to know into something you can count
- Step 2 – Create an “air-tight” description of the item or characteristic to be counted
- Step 3 – Test your Operational Definition to make sure it’s truly “air-tight”
Note: Sometimes, you’ll need to do some “digging” up-front to arrive at good operational definitions. It’s usually worth the effort!!
3. Identifying Data Sources
Existing vs. New Data
Essential Question: Does the data currently exist?
- Existing Data – Taking advantage of archived data or current measures to learn about the Output, Process or Input.
- This is preferred when the data is in a form we can use, and the Measurement System is valid (a big assumption and concern)
- New Data – Capturing and recording observations we don’t typically capture
- It may involve looking at the same “stuff” but with new Operational Definitions
- This is preferred when the data is readily and quickly collectable (it has fewer concerns with measurement problems)
Key Considerations: Existing vs. New Data
Existing vs. New Considerations
- Is existing or “historical” data adequate?
- Meet the Operational Definition?
- Truly representative of the process, group?
- Contain enough data to be analyzed?
- Gathered with a capable Measurement System?
- Cost of collecting new data
- Time required to gather new data
- The trade-offs made here, i.e. should the time and effort be taken to gather new data or only work with what we have, are significant and can have a dramatic impact on the project’s success.
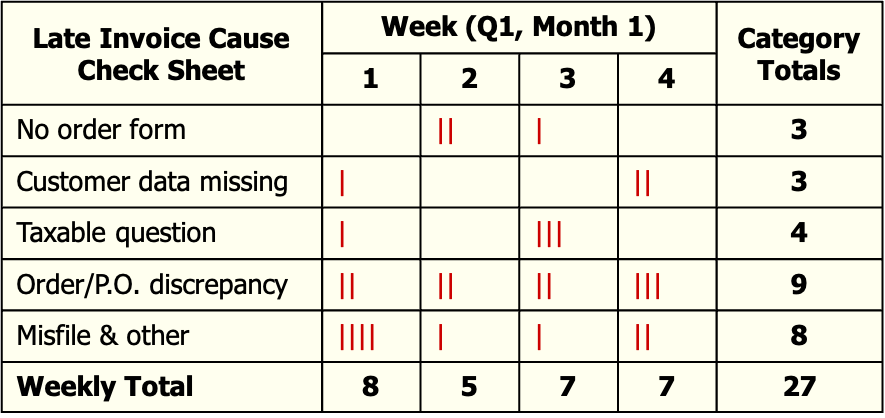
Data Collection Forms – Check Sheets
- The workhorse of data collection
- Enhance ease of collection
- Faster capture
- Consistent data from different people
- Quicker to compile data
- Capture essential descriptors of data
- “Stratification factors”
- Need to be designed for each job
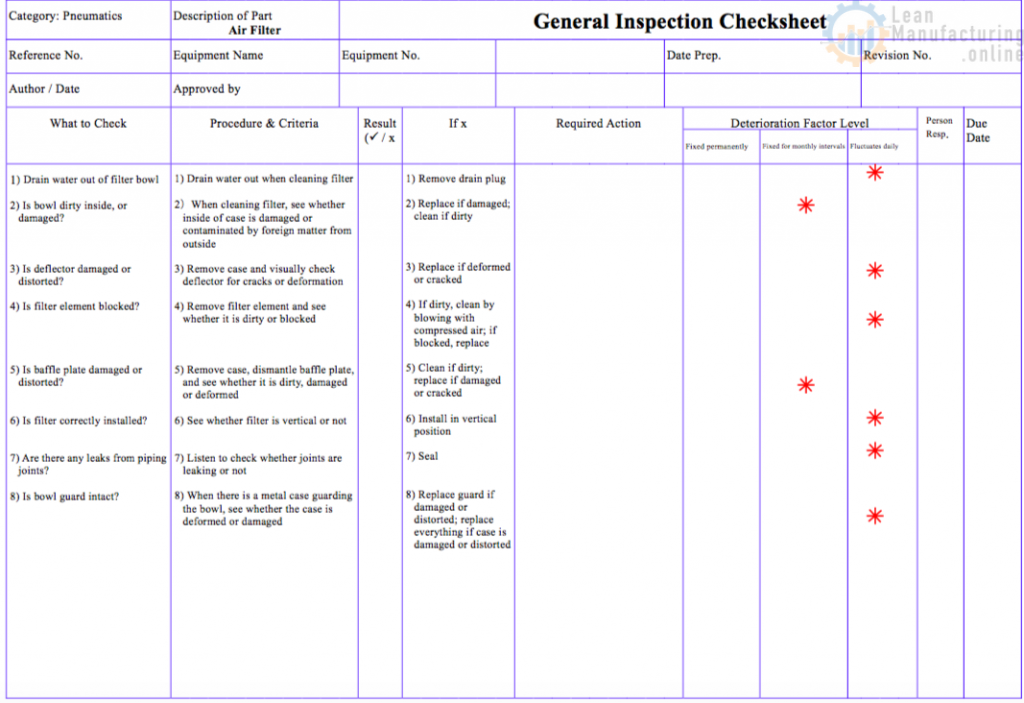
Constructing Check Sheets
- Select specific data & factors to be included
- Determine the period to be covered by the form
- Day, Week, Shift, Quarter, etc.
- Construct form.
- Be sure to include:
- Clear labels
- Enough room
- Space for notes
- Test the form!
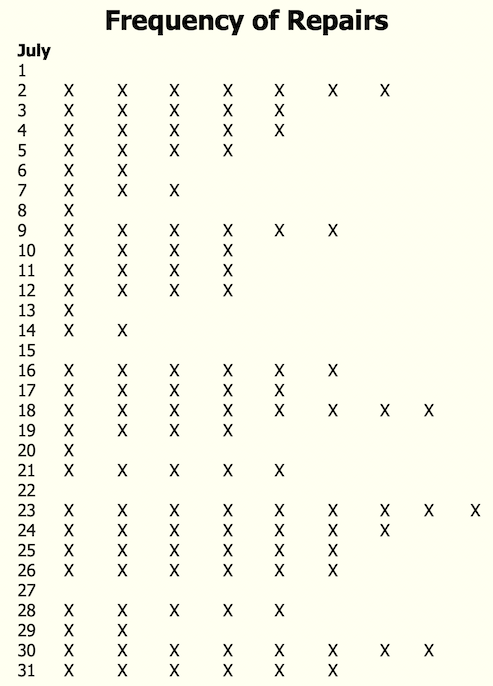
Types of Check Sheet: Frequency Plot
The frequency plot is used less frequently than the standard checksheet but is the quickest to review since it creates a picture of the data. With enough data, most frequency plots should reveal a “bell-shaped curve.” If the curve has “humps” (called “bimodal”), it’s a clue that we have more than one group represented in the data we’re collecting.
We discussed bell curves and distribution during the simulation with Histograms. We’ll spend more time on them in Data Analysis.
- Shows “distribution” of items or occurrences along a scale or ordered quantity
- It helps detect unusual patterns in a population – or detect multiple populations.
- It gives a visual picture of “average” and “range.”
Check Sheet Tips
- Include name of collector(s) (first & last)
- Reason/comment columns should be clear and concise
- Use full dates (month, date, year)
- Use explanatory title
- Consider the lowest common denominator on metric
- Minutes vs. Hours
- Inches vs. Feet
- Test and validate your design (try it out)
- Don’t change form once you’ve started, or you’ll be “starting over”!
Check Sheet Tips – Getting Data You Can Use
As you set up Check Sheets…
- Prepare a spreadsheet to compile the data.
- Think about how you’ll DO the compiling (and who’ll do it).
- Consider what sorting, graphing or other reports you’ll want to create.
- Continuous or Discrete Data?
- An Adequate level of Discrimination and Accuracy?
- •Adjust check sheet as needed to ensure usable data later.
- But don’t make data harder to collect.
Considerations:
- Familiarity with the process
- Availability/impact on job
- Rule of Thumb – If it takes someone more than 15 minutes per day, it isn’t likely to be done.
- Potential Bias
- Will finding “defects” be considered risky or a “negative”?
- Benefits of Data Collection
- Will data collection benefit the collector?
It’s okay—sometimes essential—for people outside your team to get involved in collecting data.
Before you hand responsibility for data collection to others, though, be sure you have the right people for the job.
How well you set up the measurement activity will have a big impact on the effectiveness of the measures—which is the subject of the next section.
5. Who Will Collect the Data?
Preparing Collectors
Be Sure They…
- Give input on the check sheet design
- Understand operational definitions (!)
- Understand how data will be tabulated
- It helps them see the consequences of changing
- Have been trained and allowed to practice
- Know and are unbiased
6. Sampling
- Sampling uses a smaller group to represent the whole (the foundation of “inferential” statistics).
- Benefits:
- It saves time and money
- Allows for more meaningful data
- Simplifies measurement over time
- Can improve accuracy
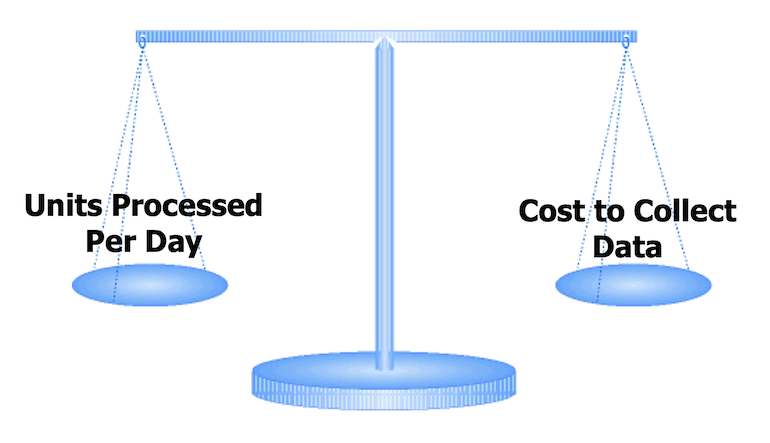
Sampling Considerations
- Time
- Cost
- Accuracy
How Many Do We Need to Count?
- Factors in Sample Size Selection:
- Situation: Population or Process
- Data Type: Continuous or Discrete
- Objectives: What you’ll do with the results
- Familiarity: What do you guess the results will be
- Certainty: How much “confidence” do you need in your conclusions
Sampling Types
- Population – Drawing from a fixed group with definable boundaries. No time element.
- Process – Sampling from a changing flow of items moving through the business. Has a time element.
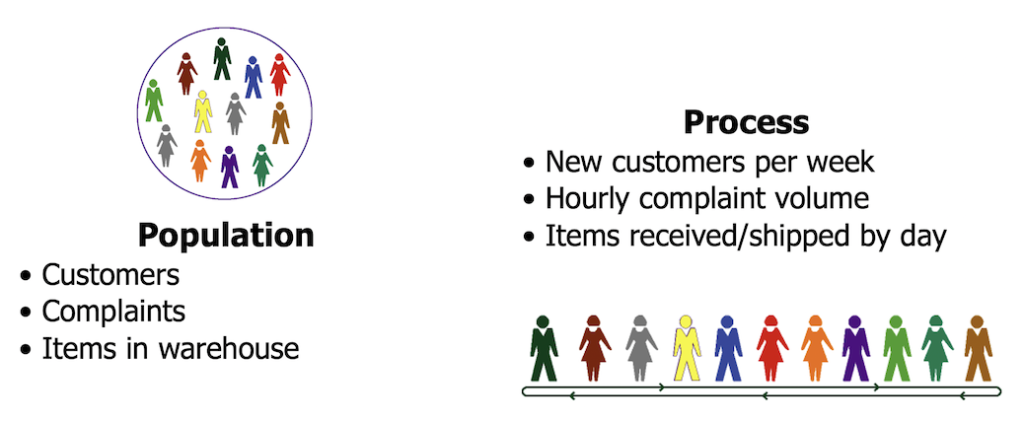
Population or Process Sampling
- Of primary importance in a Six Sigma measurement effort is to clarify if you’re engaged in Population or Process sampling.
- Most traditional statistical training focuses on Sampling from populations – a group of items or events from which a representative sample can be drawn. A population sample looks at the characteristics of the group at a particular point in time.
- Quality and business process improvement tends to focus more often on processes, where change is a constant.
- In-process Sampling, you measure characteristics of things or characteristics as they pass through the process and observe changes over time.
- Any data you collect that has “time order” included can be examined as either a population or a process. However, the size of the sample analyzed may need to be different.
- Given a choice, process data provides more information, such as trends and shifts of short duration. Process sampling techniques are the foundation of process monitoring and control.
Sampling Biases
- Self-selection
- Self-exclusion
- Missing key representatives
- Ignoring “non-conformances”
- Grouping
Consider other biases as we talk about sampling strategies…
Sampling Methods and Strategies
- The big pitfall in Sampling is “bias,” – i.e. selecting a sample that does NOT represent the whole. The sampling plan needs to guard against bias. Different methods of Sampling have various advantages and disadvantages in managing bias.
- Judgment
- As it sounds – selecting a sample based on someone’s knowledge of the process, assuming that it will be “representative.” Judgment guarantees a bias and should be avoided.
- Convenience
- Also, just like it sounds – Sampling those items or when it’s easier to gather the data. (For example, taking data from people you know or when you go for coffee.) This is another common (but ill-advised) approach.
Best Methods for Lean Six Sigma Data
- Random
- The best approach for Population situations. Use a random number table or random function in Excel or other software, or draw numbers from a hat.
- Systematic
- Most practical and unbiased in a Process situation. “Systematic” means that we select every nth unit or take samples at specific times of the day. The risk of bias comes when the timing of the sample matches a pattern in the process.
Sampling Strategies Considerations
- Should we stratify first?
- Focus on one group within the process or population?
- Ensure adequate representation from various segments of the population or process?
- Does it “feel right”?
- Sampling needs to fit common sense considerations
- Confront and manage your biases in advance
As you start to zero in on a sampling strategy, you should also examine the potential need to stratify your data collection.
Stratified Sampling takes samples independently from each segment of a larger one. For example, in gathering data on types of customers, you might take a sample specifically from each key customer type to ensure all are represented—even the smaller groups.
Common sense is also an excellent guide to any sampling plan.
Key Sampling Terms and Concepts
- Sampling Event – The act of extracting items from the population or measuring process.
- Subgroup – The number of consecutive units extracted for measurement at each Sampling Event. (A “subgroup” can be just one!)
- Sampling Frequency – Applies only to process Sampling; the number of times per day or week a sample is taken (i.e., sampling events per period of time).
These are the key elements to be included in the sampling plan: what we’ll “extract,” how many we’ll take at a time, and how often we’ll take a sample.
Population Sampling Steps
Building the “Sampling Plan”
- 1. Develop an initial profile of the data
- 2. Select a sampling strategy
- 3. Determine the initial sample size
- 4. Adjust as needed to determine the minimum sample size
Sampling – Initial Data Profile
- Population size? (Noted “N”)
- As you begin preparing the Sampling Plan, you first
need to determine the rough size of the total population.
- As you begin preparing the Sampling Plan, you first
- Stratification factors?
- If you elect to conduct a stratified sample, you
need to know the size of each subset or stratum.
- If you elect to conduct a stratified sample, you
- What precision result do you need?
- Next, you must define the precision required in your measurement. Accuracy notes how tightly your measurement will describe the result. For example, if measuring cycle time, your sample will be affected by whether you want precision in days (e.g. estimate is within +/- 2 days) or hours (estimate is within +/- 4 hours). Precision is noted by the variable “d” or D. The sample size goes up rapidly as the accuracy is tightened.
- The last step in your initial profile is estimating the population variation.
- Continuous data requires estimating the “standard deviation” of the measured variable.
- Continuous data: How much does the characteristic vary? (estimated standard deviation)
- Discrete data requires an estimate of “P,” the proportion of the population that contains the characteristic in question.
- Discrete data: What proportion contains the characteristic?
Sampling – Sampling Strategy
Your sampling strategy is the broad outline of the Plan. It needs to consider the logistics and cost of data collection, as well as the validity of the data.
- Random or systematic?
- How will we draw the sample?
- Who will conduct the “sampling event”?
- How will we guard against bias?
- Most representative vs. time, effort and cost
- No differences between what you collect and what you do not collect
Some Final Tips
- To ensure representation from different groups or strata, prepare a separate sampling plan for each group.
- Be sure to maintain the time order of your samples/subgroups to see changes over time.
- Common sense is a valuable tool in Sampling.
- Help is available if you need it!
Test, Refine and Implement
Ensuring “Quality” Measurement
- Measurement is rarely perfect – especially at first.
- Even good measurement can go “bad.”
- As you use data, lessons may include …
- How to simplify measures
- Other stratification factors needed
- Ways to improve collection forms
- Other measures to investigate
Takeaways
- A plan to collect output, process and/or input data
- How to construct forms and test data collection procedures
- Refining data collection
- Implementing a data collection plan
- Implementing a sampling plan and calculating sample size


4M Analysis Process: Root Cause Guide for Manufacturing
Learn how to use 4M Analysis to find manufacturing root causes across People, Machine, Method, and Material with diagrams, examples, and checklist.


