Lean Manufacturing

  • Lean Manufacturing
  • Home
  • Process Excellence
    • Lean Six Sigma
    • TPM
      • TPM Introduction
      • Change Management
      • Focused Improvement
      • Autonomous Maintenance
      • Education and Training
      • Quality
      • Safety, Health and Environment
      • Planned Maintenance
      • Early Equipment Management
    • TPS
    • Tools
      • Last Minute Travel Deals
      • 5 Why Analysis
      • Cap-Do
      • Kaizen
      • FMEA
      • One Point Lessons Directory
    • Templates
      • Machine Ledger
      • 5S Audit Checklist and Report
      • Cap-Do (PDCA)
      • One Point Lesson
      • FMEA template
      • M-P Sheet and EEM Template Guide
      • Why-Why Analysis
  • Free Courses
    • Lean Six Sigma White Belt Course
    • Lean Six Sigma Yellow Belt Course
    • Lean Six Sigma Green Belt Exam
    • Lean Six Sigma Black Belt Exam
    • TPM Instructor Course
    • Agile Retrospective: Continuous Improvement and Kaizen with Scrum
    • Autonomous Maintenance Facilitator
    • Planned Maintenance Facilitator
  • Submit a Post
  • Contact
Home TPM (page 40)

TPM

  • The 7 QC Tools – Graphs and Charts

    sensei August 8, 2021
    0 6,052
    Focused Improvement TPM

    Graphs and charts are an essential part of the problem-solving toolkit.

    Read More »
  • The 7 QC Tools – Control Charts

    sensei August 7, 2021
    1 8,135
    Focused Improvement TPM

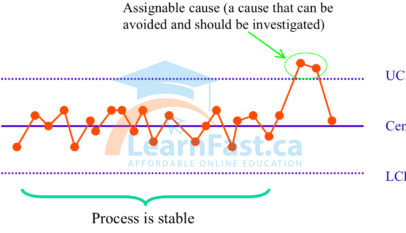
    Control charts can be used for attributes (discrete data that, by its nature, can only be expressed as positive integers, such as numbers of people and incidences of failure), or for variables (continuous data such as length, weight, time or temperature).

    Read More »
  • The 7 QC Tools – Pareto and Scatter Diagrams

    sensei August 5, 2021
    1 11,495

    The losses may also be classified by their causes or by the situations in which they appear.

    Read More »
  • The 7 QC Tools – Histograms

    sensei August 4, 2021
    0 3,300
    Focused Improvement TPM
    Histogram QC Tool

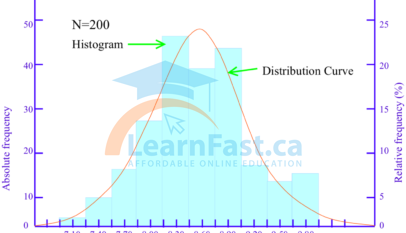
    (3) Histograms Although the overall distribution pattern can be deduced from the data points in a frequency distribution table, the distribution can also be represented as a column graph, known as a histogram (see Figure “A Histogram”). The histogram is employed to reveal mean values and variation patterns, the histogram…

    Read More »
Previous page Next page

Most Popular

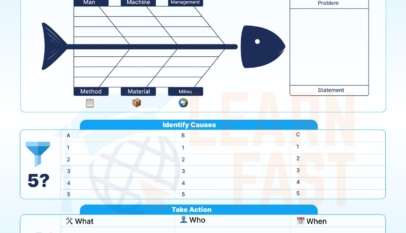
4M Analysis fishbone diagram showing People, Machine, Method, and Material root cause categories

4M Analysis Process: Root Cause Guide for Manufacturing

sensei
August 29, 2018

Learn how to use 4M Analysis to find manufacturing root causes across People, Machine, Method, and Material with diagrams, examples, and checklist.
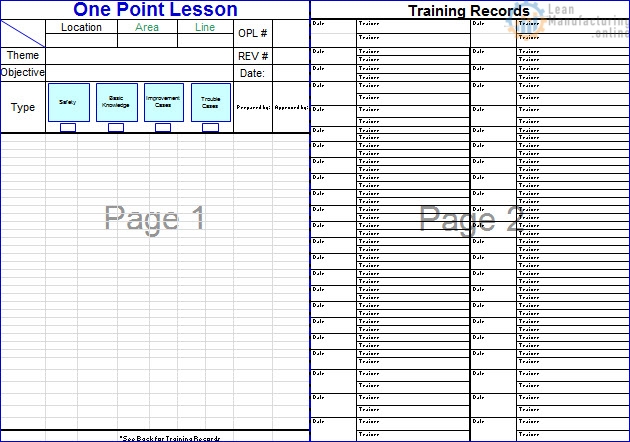
OPL – One Point Lesson Template – Free Download

sensei
November 5, 2018

PDCA – A Process Approach

sensei
January 8, 2023
5S checklist and audit visual standard for workplace organization

5S Audit Checklist and Report

sensei
April 18, 2022

Why-Why Analysis

sensei
June 10, 2022

Recent

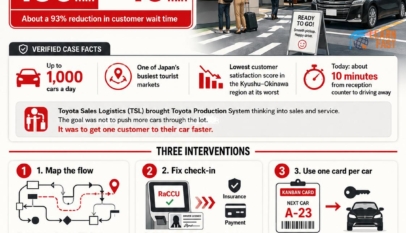
Toyota’s Rental Car Kaizen Success

PDCA and 5 Why workflow for Kaizen problem solving

4M Analysis Examples for Manufacturing Problems

Free Online Certificate Courses Worth Your Time This Year

Industrial Internet of Things in Manufacturing: Uses, Architecture, and Benefits

Blog Search

Lean Manufacturing is a methodology for producing goods that emphasizes minimizing waste and maximizing efficiency. It is a manufacturing philosophy that aims to produce goods with the least amount of resources, time and effort. Lean manufacturing aims to eliminate waste and improve the flow of materials and information throughout the production process. This approach is often used in manufacturing environments where efficiency and cost-effectiveness are critical, such as in the automotive and electronics industries.
Copyright © 2026 leanmanufacturing.online
  • Terms of Use
  • Privacy Policy
  • About Our Ads

Popular Posts

4M Analysis fishbone diagram showing People, Machine, Method, and Material root cause categories

4M Analysis Process: Root Cause Guide for Manufacturing

sensei
August 29, 2018

Learn how to use 4M Analysis to find manufacturing root causes across People, Machine, Method, and Material with diagrams, examples, and checklist.

OPL – One Point Lesson Template – Free Download

sensei
November 5, 2018

PDCA – A Process Approach

sensei
January 8, 2023
5S checklist and audit visual standard for workplace organization

5S Audit Checklist and Report

sensei
April 18, 2022

Most Popular Tools

PDCA and 5 Why workflow for Kaizen problem solving

4M Analysis Examples for Manufacturing Problems

Toyota Production System with kaizen standardization jidoka and just in time

Kaizen Mindsets: 24 Principles for Lasting Change

Innovation vs. Kaizen Explained

How Kaizen and PMP Work Together