TPM
The 7 QC Tools – Ishikawa Diagram and Checksheets
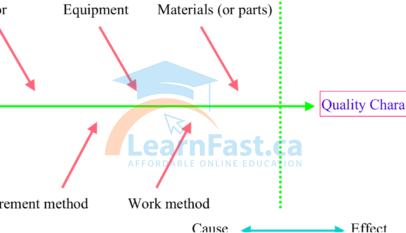
(1) Cause-and-effect diagrams The cause-and-effect diagram (also known as the fishbone diagram or Ishikawa diagram) was developed by the Japanese quality guru Dr. Kaoru Ishikawa to express one of the basic principles of total quality management, that the desired product, target or other outcome is achieved not by directly controlling…
Read More »Focused Improvement – The QC Story
The QC story (or Improvement Story) is a simple, practical way of doing this and thereby solving problems efficiently.
Read More »Tools and Techniques for Focused Improvement
In-house failure date (MTBFs), manufacturers’ data, test data, and other data for predicting the reliability of machinery, apparatus, components, behaviours, etc., are helpful for performing internal forecasting reviews on equipment.
Read More »Rolling Out Focused Improvement Step by Step
Sporadic breakdowns have not been distinguished from chronic ones.
Read More »
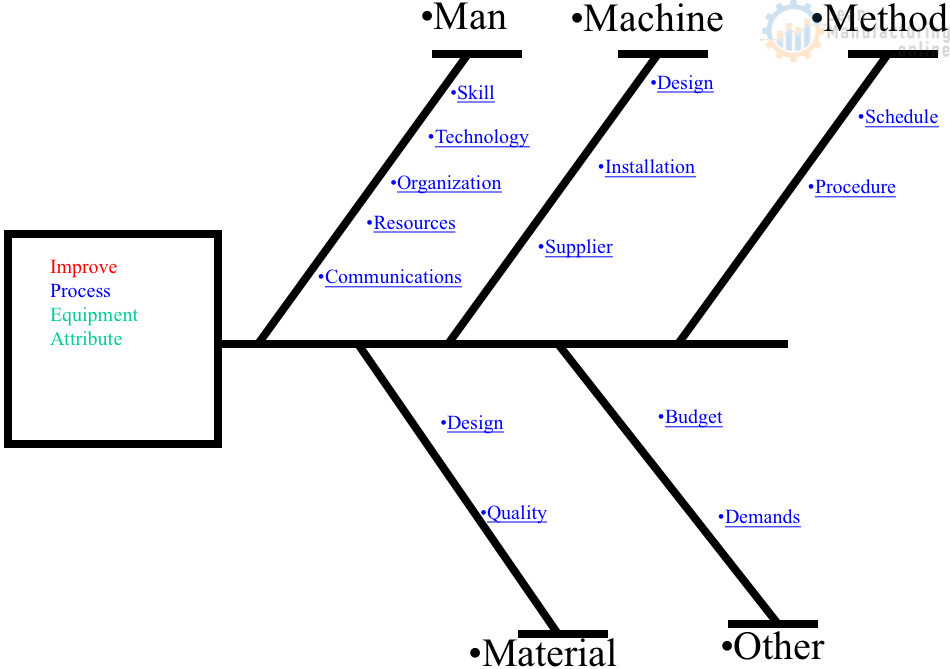
4M Analysis Process: Root Cause Guide for Manufacturing
Learn how to use 4M Analysis to find manufacturing root causes across People, Machine, Method, and Material with diagrams, examples, and checklist.