Data and facts are fundamental to every quality improvement effort. Without the facts, our problem-solving efforts are reduced to a “guessing game”.
Generating Information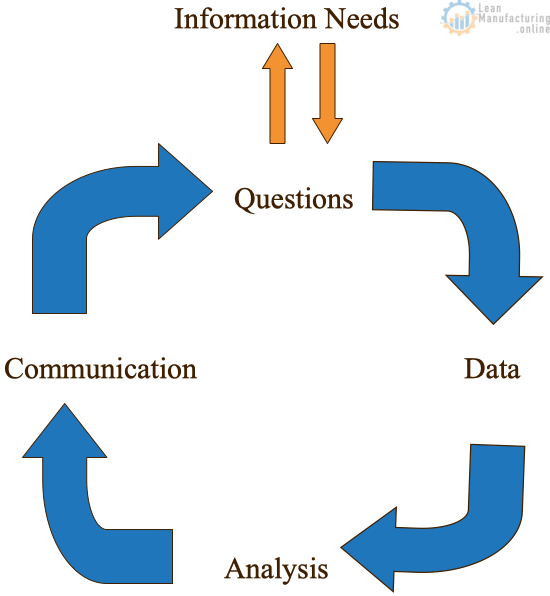
- Formulate the question we’re trying to answer
- Collect the data relating to that question
- Analyze the data to answer the question
- Clearly present the data to communicate the answer.
What is Involved in Data Collection?
- What question are we trying to answer?
- How will we recognize and communicate the answers to the questions?
- What data-analysis tools (Pareto diagram, histogram, bar graph, etc.) do we envision using, and how will we communicate the results.
- Where in the process can we get this data?
- Who will give us this data?
- How can we collect this data from these people with the minimum effort and chance of error?
- What additional information do we need to capture for future analysis, reference, and traceability?
How to Collect Data
- Formulate the precise question(s) relating to what information is needed
- Discuss the difference between the following pair of questions:
- Which will result in the most successful data collection effort?
- a. Are the branch offices making errors that waste resources in our warehousing operation? OR
- b. What percentage of orders received in the warehouse from our branch offices requires you to follow up with the salesperson or customer because the information was missing, conflicting, or incorrect on the order form?
- Which will result in the most successful data collection effort?
- Discuss the difference between the following pair of questions:
- Identify which data analysis tools will be used
- Different analysis tools require different types of data. In general, there are 2 types of data:
- Attribute: Data is placed in categories (conforming/non-conforming), types of complaints, defects, etc.) Analysis Tools for Attribute Data: Bar graphs, Pareto analysis, types of Pie charts;
- Variable: Actual measurement values (Can also be categorized for use as Attribute data ). Analysis Tools for Variable Data: Line graphs, Histograms, Scatter diagrams
- Different analysis tools require different types of data. In general, there are 2 types of data:
- Define the collection point(s)
- Should be at a point of minimum disruption to the operation
- Make the entire scope of the operation being studied is considered
- Select unbiased collector(s)
- Understand the data collector(s) (Training & experience, amount of available time amount of physical handling, direct training or written instructions)
- Prepare a simple data collection form
- KISS (Keep it simple, stupid); Reduce opportunities for errors
- Think ahead: Capture information for future analysis and reference
- The form should be self-explanatory & look professional
- Data recording must be easy.
- Design the form with the collector’s needs in mind.
- Remember that words mean different things to different people
- Prepare instructions for use
- Test the forms and instructions in the operational environment.
- Following the test, cross-check that the data:
- Will answer the question(s)
- Covers all places, times & conditions of the process
- The most common problems with forms are:
- Errors caused by misunderstandings about how to fill out the form
- Form designer did not understand all of the variables of the process
- Incomplete data because the form was too difficult to complete in the midst of problems.
- Incomplete or biased data because the people filling out the forms feared the information would be used against them.
- Following the test, cross-check that the data:
- Train the data collectors
- Explain:
- The purpose of the study
- What you intend to do with the data
- Meaning of every item on the form
- The importance of complete and unbiased data
- Show a properly filled out form and address any comments or questions
- Explain:
- Audit the collection process and validate the results
- Randomly review completed forms and observe the collection process
- Validate results by checking the amount of data collected, look at missing or unusual observations, and look for patterns that may indicate biases.
Pitfalls in Data Interpretation
| PITFALL | REMEDY |
| Part of the process being studied is left out of the data collection | Data should be collected from all places, times, and conditions under which the process operates |
| The act of collecting the data may affect the process being studied. | Test the form in the operational environment. |
| Attitudes and beliefs of the data collectors can color what they see and how they record it. | Select unbiased data collectors, understand the data collectors and train them appropriately. |
| Failure to follow the established procedures | Keep the form simple, prepare explicit instructions, test the form and instructions in the operational environment, & train the data collectors. |
| Missing data; Assuming that missing data looks like the collected data. | Audit the data collection process to make sure that all data is being captured. If data is found to be missing at the end of the data collection process, extend the data collection process to compensate. |
| Errors in transcribing and processing the collected data | Select individuals with the right skills & experience and train them. Audit data after transcription and again after processing. |
Tips for Data Collection
- Complete the Data Setup Sheet
- Give the sheet a name and/or number
- Assign responsibilities
- Give plenty of time to plan the data collection
- Continually ask yourself who, what, when, why, and where
- Keep the objective (what you hope to find out) simple and don’t try to tack on too many other things


4M Analysis Process: Root Cause Guide for Manufacturing
Learn how to use 4M Analysis to find manufacturing root causes across People, Machine, Method, and Material with diagrams, examples, and checklist.


