Hypothesis Testing is a statistical tool, that allows the resemblance of two or more process attributes – mean, median, and standard deviation. It provides a method to determine differences.
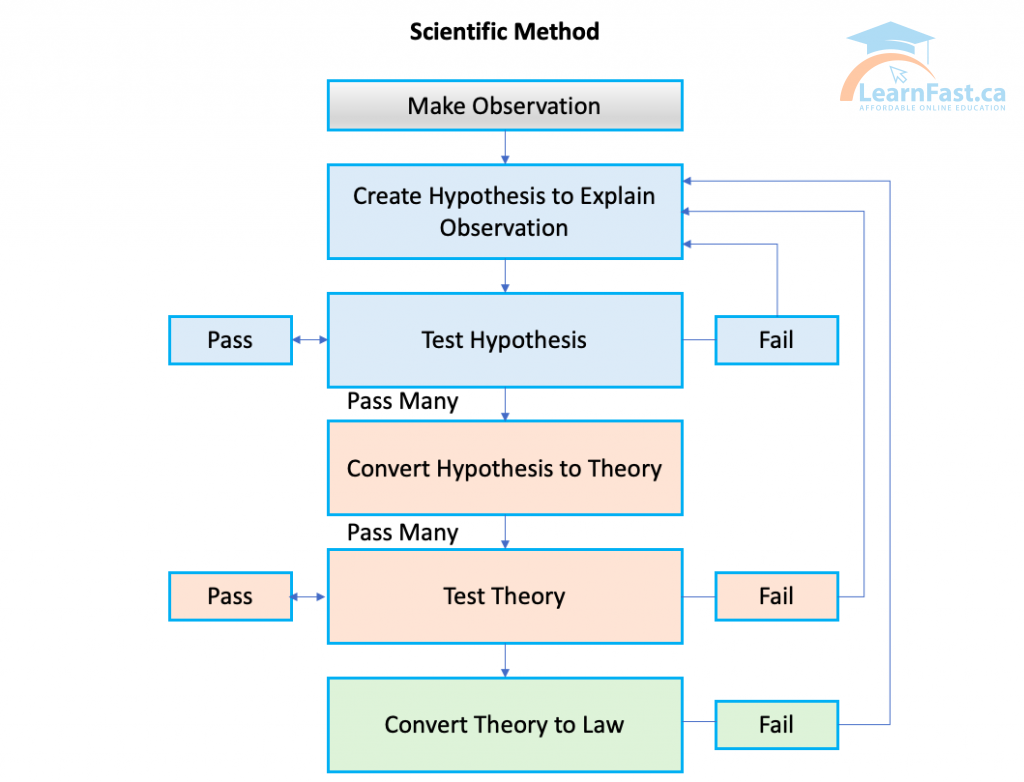
- An important part of a conclusion reached based on random sampling (statistical inference)
- A hypothesis is a statement we want to verify using data
- is there a difference?
- has there been a change?
- A hypothesis is a statement we want to verify using data
- Null and Alternative hypotheses are formed
- Level of risk and confidence required
- Experimentation is conducted, and interpret the results
- Fail to reject the null hypothesis
- No change. No difference, or…
- Reject the null hypothesis
- There is a change, a difference
- Fail to reject the null hypothesis
What might we “Test” for?
We will be testing for a Change or Difference in Process…
- Central Tendency
- Mean, Median, Mode
- Variation
- Variance, Standard Deviation
- Proportion
- % (ratio, proportion)
- Frequency (of occurrence)
- Distribution of count/frequency
Testing Protocol
- “Null” hypothesis (H0)
- This statement validates the status quo – no significant change will be observed. Any differences detected are purely due to chance and not a change in the process.
- Symbols:
- = (equals)
- < (not less than)
- > (not greater than)
- “Alternative” hypothesis (H1)
- This is a statement that there will be a difference in statistical significance detected; there has been a change.
- Symbols:
- <> (doesn’t equal)
- < (is less than)
- > (is greater than)
The hypotheses are complementary to each other. If one is true, the other is not true, and vice versa.
If the p is low, the null must go!
When performing any statistical test, the outcome is based on sampling from the population; therefore, there is room for error. Most statistical tests are run with a 95% confidence level, indicating a 5% chance of making an error.
The decision to accept or reject the null hypothesis is predicated on the calculated p value. If the p value is a smaller amount than or adequate to a preassigned significance level (normally set at 5%), then we reject the null hypothesis and accept the alternative.
A p value will be calculated by the statistical software when running a hypothesis test.
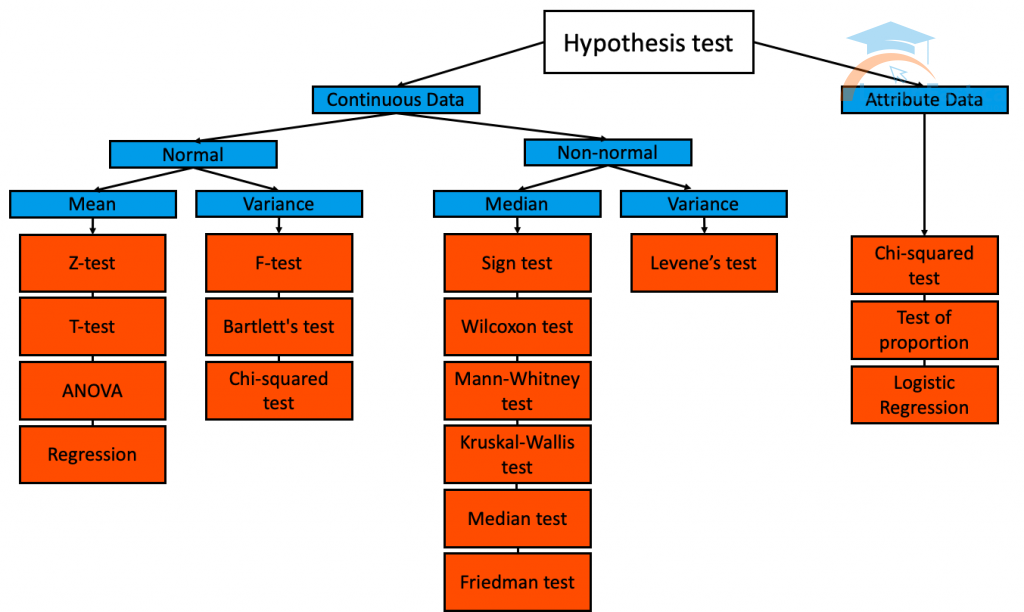
Types of Hypothesis Testing
There are many different types of hypothesis tests, and they can be divided into two main categories:
- Parametric tests
- Makes inferences about parameters like mean and variance
- Based on assumptions of specific distributions (ex. “normal” or “t” distributions)
- Non-parametric tests
- Makes inferences about frequency distribution like median, distribution type
- Usually include sign and rank tests (a type of “math” used)
- Do not require normality assumptions (but have some assumptions… always check them!)
Depending on the type of data you have collected, and whether it’s normal or non-normal, several hypothesis tests are available for comparing process characteristics.


4M Analysis Process: Root Cause Guide for Manufacturing
Learn how to use 4M Analysis to find manufacturing root causes across People, Machine, Method, and Material with diagrams, examples, and checklist.


