
Manufacturing KPIs are only useful when they help people make better decisions. A long list of metrics may look impressive, but it often creates confusion: every department has numbers, every board has charts, and nobody is sure which few indicators deserve attention today.
A strong KPI system connects three things: the business objective, the process condition, and the daily action. When those three are aligned, KPIs stop being reports and become a management system.

What makes a manufacturing KPI useful?
A manufacturing KPI should answer a practical question. Are we safe? Are we producing good parts? Are we meeting the plan? Are our machines reliable? Are people trained for the work? Are improvement actions closing the gap?
The best KPIs are not selected because they are easy to count. They are selected because they reveal a gap between the current condition and the target condition. That gap should trigger a conversation, a countermeasure, and follow-up at the next review.
| KPI test | Good question to ask | Warning sign |
|---|---|---|
| Purpose | What decision will this metric support? | The number is reported but nobody uses it. |
| Ownership | Who can influence the result? | The owner can explain the gap but cannot act on it. |
| Frequency | How often should the team review it? | The metric is reviewed too late to correct the process. |
| Balance | Does it protect safety, quality, delivery, and cost? | One metric improves while another critical area gets worse. |
| Action | What happens when the result is red? | The team only updates the chart. |
Start with a balanced KPI set
Manufacturing performance should not be managed with one number. If the only visible KPI is output, teams may be pushed to run faster while quality, safety, maintenance, and training suffer. A better approach is a small balanced set that shows whether the system is healthy.
| Area | Example KPI | What it tells you |
|---|---|---|
| Safety | Hazards found and closed, near misses, safety actions overdue | Whether the workplace is improving before injuries occur. |
| Quality | First-pass yield, defects per unit, customer complaints, rework hours | Whether the process is producing good output consistently. |
| Delivery | Schedule attainment, on-time delivery, plan-versus-actual output | Whether the process can meet customer demand reliably. |
| Cost | Scrap cost, overtime, material loss, conversion cost variance | Whether losses are being controlled without hurting other priorities. |
| Equipment | OEE, availability, breakdowns, mean time between failures | Whether machines are stable enough to support the plan. |
| People | Skill coverage, training completion, certification gaps | Whether the team has the capability to run and improve the process. |
Use leading and lagging indicators
Lagging indicators show what already happened. Examples include monthly scrap cost, customer complaints, downtime hours, or shipped output. They are important, but they are often too late for daily control.
Leading indicators show whether the process is likely to perform well. Examples include completed autonomous maintenance checks, open F-tags, overdue planned maintenance, training gaps, first-piece confirmation, or daily abnormality closure. These indicators help teams act before the monthly result is damaged.
This is where activity boards and visual management become powerful. A board should not only display results. It should show targets, abnormalities, owners, due dates, and the next action.
Equipment KPIs: make OEE actionable
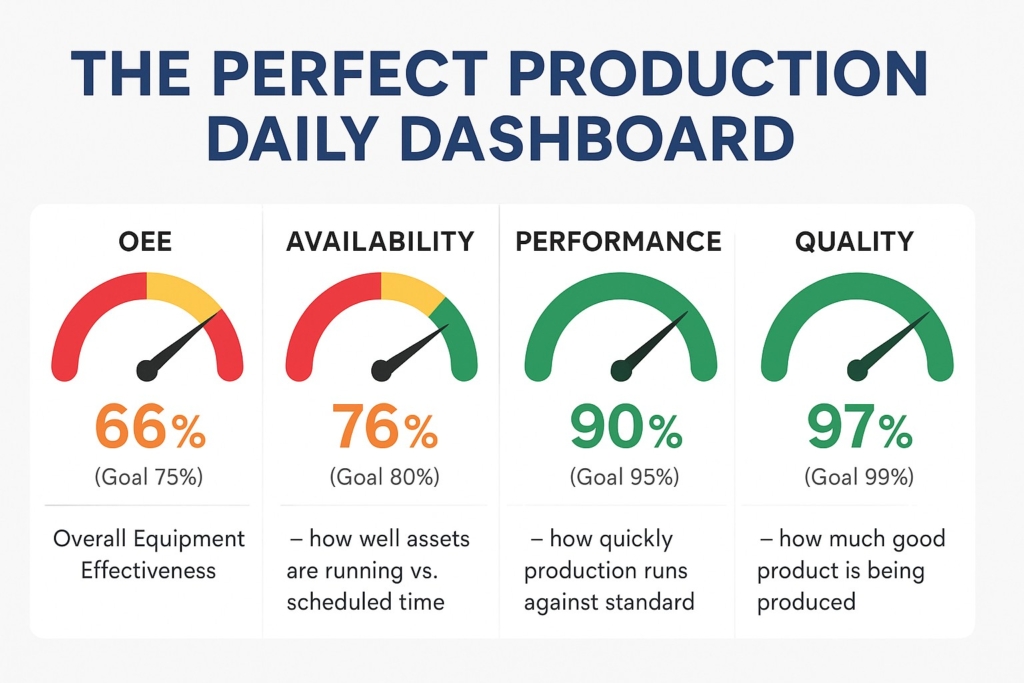
OEE can be useful, but only when it points to specific losses. A single OEE percentage does not tell the team what to fix. Break it into availability, performance, and quality, then connect each loss to an action owner.
| OEE component | Typical loss | Better follow-up question |
|---|---|---|
| Availability | Breakdowns, changeovers, waiting for material | Which stoppage pattern should we eliminate first? |
| Performance | Minor stops, speed loss, unstable cycle time | What condition causes the equipment to run below standard? |
| Quality | Scrap, rework, startup defects | Which defect mode is most frequent or most expensive? |
For equipment-heavy processes, connect KPI review with autonomous maintenance, planned maintenance, and forced versus natural deterioration. This keeps the conversation focused on restoring basic conditions and preventing repeat failures.
Quality KPIs: separate detection from prevention
Quality dashboards often count defects, rejects, and customer complaints. Those numbers matter, but they usually describe detection after the problem has already happened. A stronger system also measures prevention.
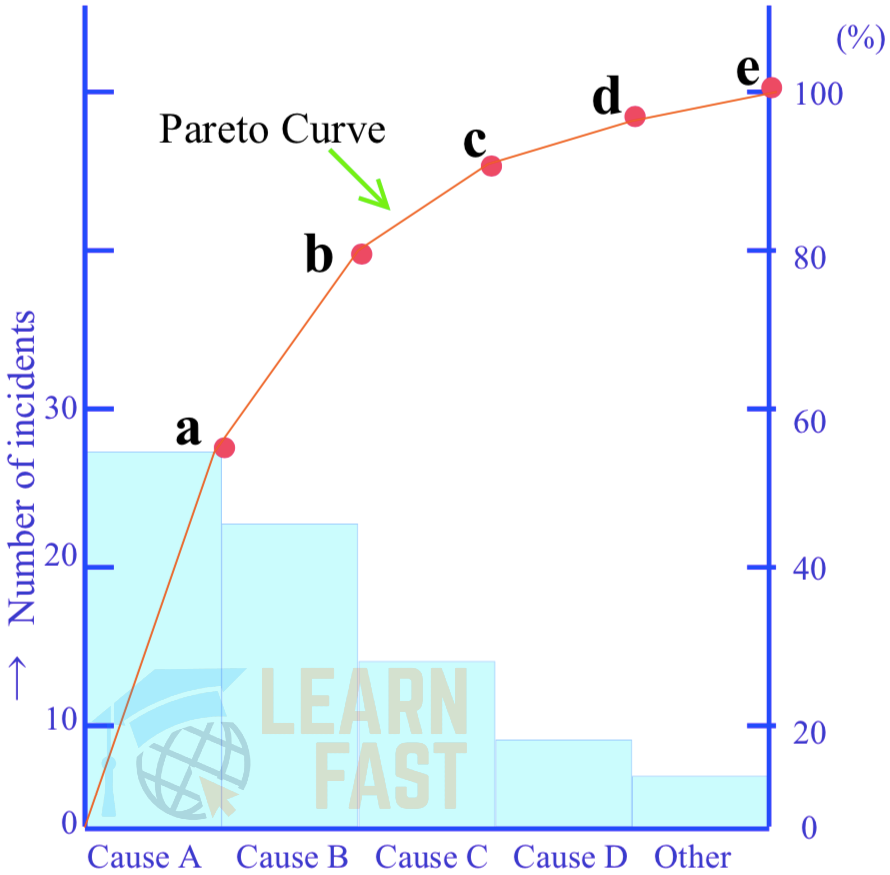
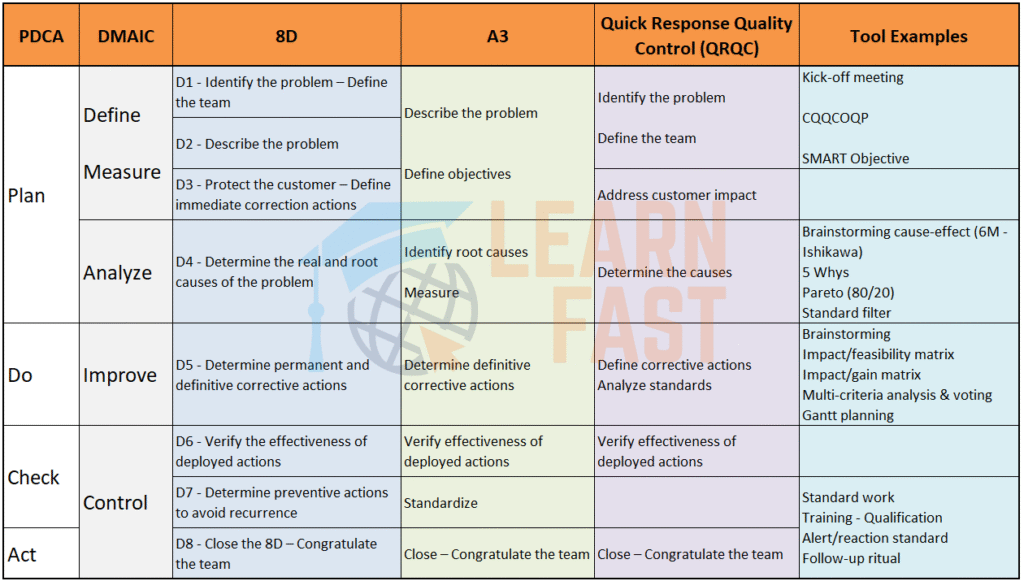
Examples of prevention-focused quality KPIs include completed layered checks, standard work adherence, first-piece approval, critical parameter confirmation, mistake-proofing status, and overdue corrective actions. When a quality KPI is red, use structured problem solving such as 4M analysis and confirm whether the countermeasure changes the process, not only the report.
Maintenance KPIs: avoid rewarding firefighting
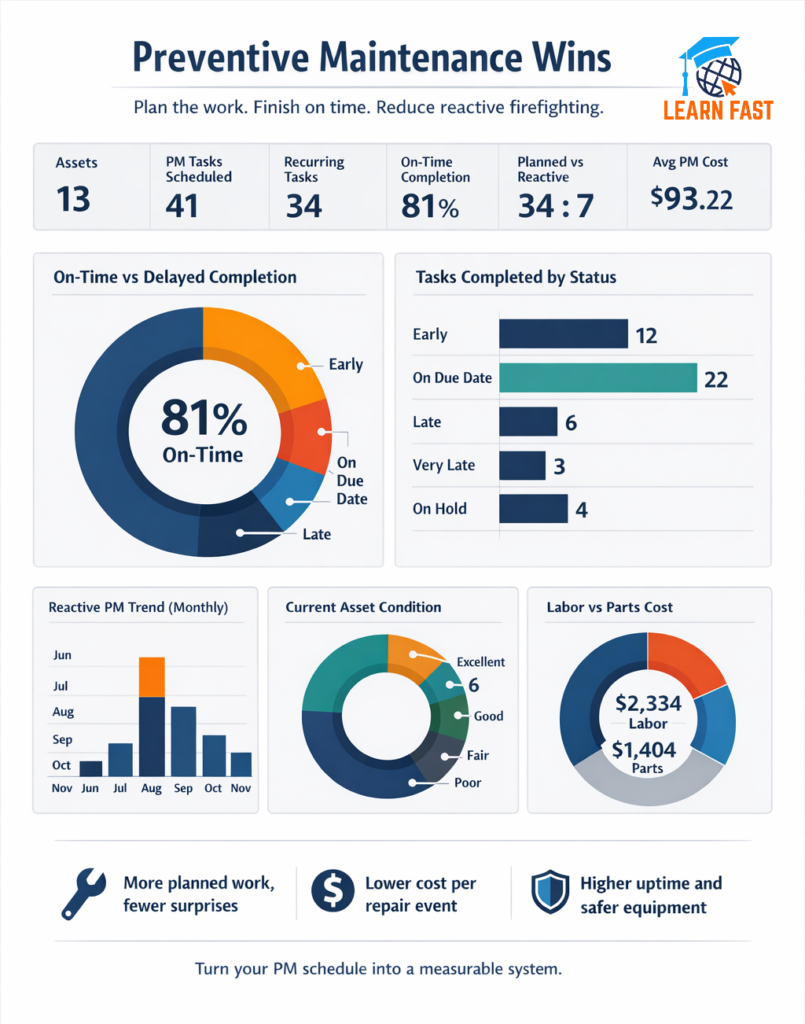
Maintenance performance should not be judged only by how quickly technicians respond to emergencies. Fast reaction is good, but a mature maintenance system should reduce the need for emergency reaction in the first place.
| KPI | Why it matters | What to watch |
|---|---|---|
| Planned maintenance compliance | Shows whether scheduled work is completed on time. | High compliance with poor reliability may mean the PM content is weak. |
| Emergency work percentage | Shows how much work is reactive. | A rising trend means the system is losing control. |
| Repeat breakdowns | Shows whether root causes are being removed. | Repeated failures often point to poor standards or basic conditions. |
| Open abnormality tags | Shows whether small problems are being captured and closed. | Old open tags can become future breakdowns. |
Use F-tags to connect abnormalities to ownership and closure. For safety-critical work, keep the review aligned with approved procedures and controls such as LOTO.
People KPIs: measure capability, not only attendance
Training hours alone do not prove capability. A better people KPI shows whether the team can perform the required work safely, correctly, and consistently. A manufacturing skill matrix can show gaps by role, line, shift, and process.
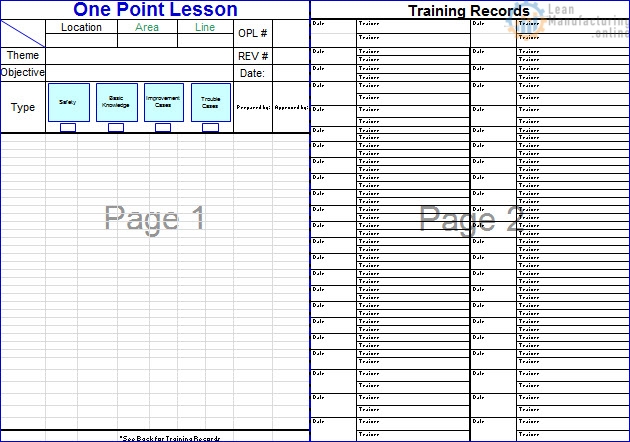
Useful people KPIs include skill coverage by critical operation, certification completion, cross-training progress, trainer availability, and overdue skill renewals. When a gap is found, use one point lessons to reinforce key standards at the point of use.
How to review KPIs in daily management
The daily KPI review should be short, visual, and action-oriented. The leader should not ask only, “What is the number?” The better sequence is to confirm the target, compare actual performance, identify the gap, assign action, and follow up on whether the action changed the result.
| Review step | Question | Output |
|---|---|---|
| Confirm the target | What should have happened? | Clear standard or plan. |
| Compare actual | What actually happened? | Green or red status. |
| Identify the gap | Where is the biggest abnormality? | Problem statement. |
| Assign action | Who owns the next step and by when? | Action with owner and due date. |
| Follow up | Did the action change the result? | Learning and adjustment. |
Common KPI mistakes
The most common mistake is measuring too many things. When everything is a KPI, nothing is a priority. Another mistake is using KPIs to blame people instead of improving processes. Blame makes problems disappear from the board; process thinking brings problems to the surface.
A third mistake is reviewing red numbers without changing the management routine. A KPI should trigger action. If a red result does not create a problem statement, owner, due date, and follow-up, the KPI is only decoration.
Manufacturing KPI starter set
For most production environments, start small. Choose a few indicators that reveal the health of the process and review them consistently. Add detail only when the team has a clear use for the data.
| Level | Recommended KPI focus |
|---|---|
| Cell or line | Safety abnormalities, plan attainment, defects, downtime, and open actions. |
| Department | Schedule attainment, scrap, OEE losses, maintenance compliance, and skill coverage. |
| Plant | Customer delivery, total cost losses, quality escapes, capacity, and strategic improvement progress. |
Turn KPI gaps into action
A KPI is a promise to pay attention. If the metric is important enough to show on a dashboard, it should be important enough to manage through action. Keep the list short, connect each KPI to a process owner, and use the review to improve the system every day.
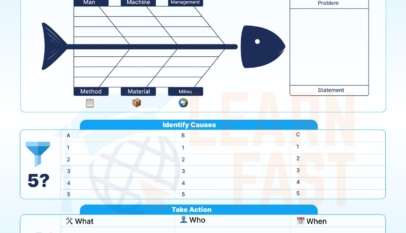




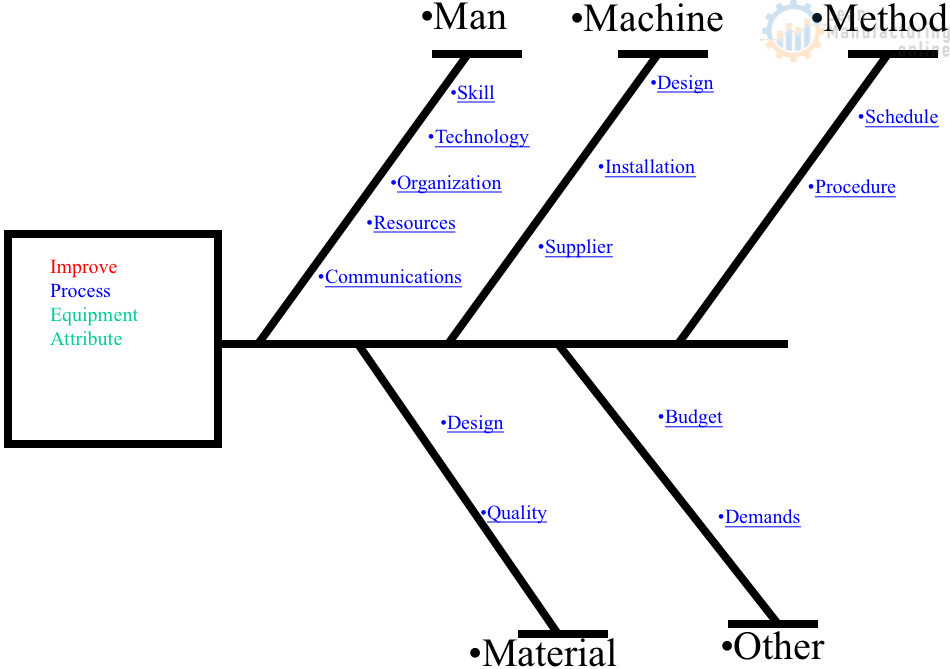
4M Analysis Process: Root Cause Guide for Manufacturing
Learn how to use 4M Analysis to find manufacturing root causes across People, Machine, Method, and Material with diagrams, examples, and checklist.


Please share this KPI template
Please share this KPI template
Template here: https://zbk.li/KPI