(adsbygoogle = window.adsbygoogle || []).push({});“Implementation of Lean Six Sigma methodology to improve machining flatness and meet internal machining rejection target”
Project Report
1. INTRODUCTION
1.1. COMPANY OVERVIEW
Manufacturing company ABC provides aluminum to automobile industries and possesses a wide range of casting and machining setups. For the last few months, the company has been facing an inclining rejection ratio in-house as well at the customer end, which has become critical to the cost and goodwill of the company. The supply efficiency is also severely affected. The top management has decided to identify the cause and cope with the effects of the implementation of Lean Six Sigma in the process.
1.2. CURRENT STATUS LEAN SIX SIGMA
The opportunity to implement Lean Six Sigma exists as there’s no current system. Using the DMAIC approach for Lean Six Sigma could be useful to determine the problems and provide effective solutions.
1.3. PROJECT TITLE
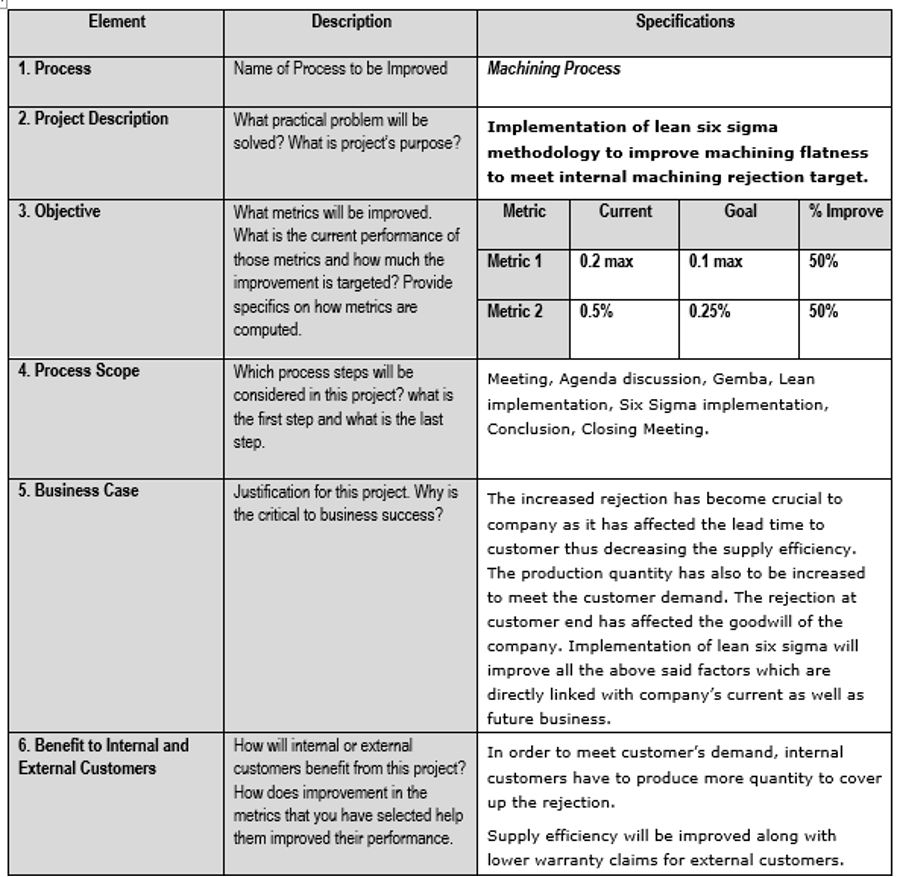
Implement lean six sigma methodology to improve machining flatness to meet internal machining rejection targets.
1.4. OBJECTIVES
- To reduce flatness from 0.2 max to 0.1 max.
- To reduce the rejection ratio from 0.5% to 0.25%.
2. METHODOLOGY
This chapter includes the DMAIC methodology, which was applied to the process to achieve objectives.
2.1. DEFINE
The first step establishes the project’s scope by defining the problems. This process is done by developing the project charter. Starting with identifying the problem, the scope of the project and critical metrics are chosen. This helps the stakeholders in understanding the problems and focusing on the objectives.
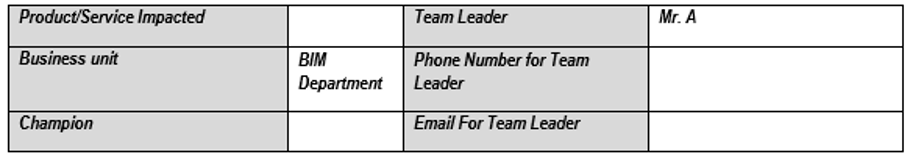
2.1.1. Project Charter
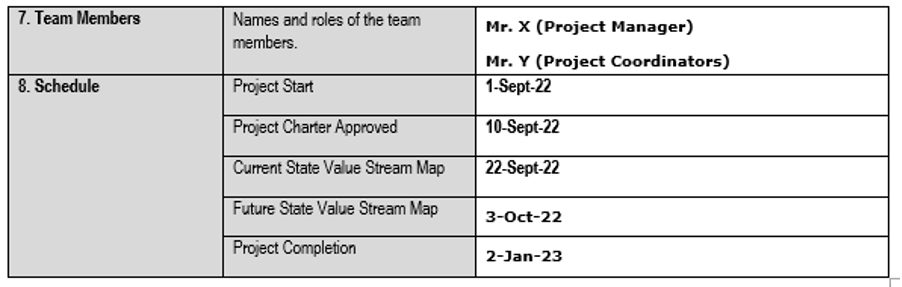
Project Charter defines the process that needs to be improved. It outlines the project description and the opportunity to implement Lean Six Sigma. Project objectives, scope, key metrics, the project team and schedule are also clearly defined in the project charter. Figure 1 describes all the necessary information about the project team and resources.
2.1.2. Process Flow Chart
A process flow chart is a diagram showing all the steps to produce a product from start to end. All the inputs/outputs and bottlenecks can be visualized.
ed in the flow charts. The step-by-step process is drawn from raw material to casting and then machining processes. After the machining process assembly process, the part goes through a quality check before dispatching to the customer. Figure 2 shows the mapping of the whole process. It was identified that most of the rejections are observed at the machining stage.

2.1.3. SIPOC
SIPOC is the acronym for Supplier, Input, Process, Output and Customer. It is a tool used in the ‘Define phase’ for a high-level view of the process. SIPOC diagrams gather vital data about the beginning and end of a process and graphically represent the events necessary to get a given result.
SIPOC was conducted for the machining process in which suppliers and customers are internal departments. The conducted SIPOC is shown in Figure 3.
| Supplier | Inputs | Process | Outputs | Customer |
| Die Casting Shop | The part after Manual Machining | Manual Machining | Machining requirements for the CNC process | CNC Machining |
| CNC Machining | Joint-Faced Drill Part | CNC Machining | Workpiece (After Machining) | Quality Department |
| Production In-charge | Machining requirements for CNC process | CNC machining process to achieve the desired shape, size and surface finish | Finished CNC machined part | Line Inspector |
2.1.4. RACI
RACI is the matrix used to define roles and responsibilities for each action within a project. RACI is the acronym for Responsibility, Accountability, and Consulted & Informed. The RACI matrix was built to specify the level of involvement of each stakeholder, as shown in Figure 4.
| Activity or Decision | Black LSS Champion | Project Coordinator | Production Dept | Quality Dept |
| Defining the problem in Project Charter | C | A | R | I |
| Draw Flowchart, SIPOC of project | C | I | R | A |
| Collect Data | C | R | I | A |
| Check whether the process is within control after interventions | R | A | I | C |
| Brainstorming session for the possible solutions | A | R | C | I |
| Implementation of improvements | A | R | C | I |
| Check whether process is within control after interventions | R | A | C | I |
Project Development Plan and Timeline (Gantt Chart)

2.1.5. Voice of Customer/ Critical to Quality Parameter
Internal and external customers were involved in discussing the facing problem; the external customer received warranty claims from end users. The claimed parts were taken from the customer to investigate the reasons for the rejection. On the other hand, Gemba was conducted, and the process was observed in-depth; interviews were conducted with internal customers to understand the problems workers faced routinely. Suggestions were also taken from the workers through a brainstorming session where their concerns and the best practical solution were discussed.
2.2. MEASURE
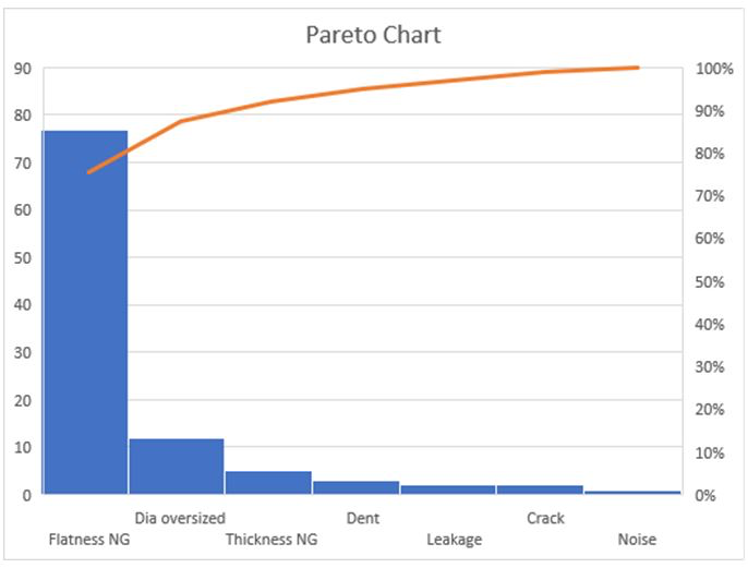
The measure phase is the second stage of DMAIC. The main purpose of this step is to define the current state of the process and collect the data for root cause analysis of the problems. First, the detailed report of rejection, along with its reasons, was compiled. A Pareto chart was developed to highlight 80% of the rejections are due to 20% of the problem, as shown in Figure 6. It was summarized that ‘flatness NG’ is the worst defect that played a part in most of the rejections.
2.2.1. Data Collection (Before Improvement)
Flatness data after the machining process was taken at the current stage. The sample size was 50 parts. The parts were selected randomly from the production every 15 mins so that the consistency of the process may be checked. Process capability analysis was done to check the performance and consistency of the process initially; current readings are judged, which can be helpful in comparison of the results after Improvement. The flatness observed at the current stage was 0.22 max, as shown in Figure 7. The rejection ratio was calculated with the production quantity and rejected parts. At the current stage, the rejection percentage observed due to flatness NG is 0.5%.

2.2.2. Process Capability
Process Capability analysis measures a process’s ability to perform relative to design specifications. It identifies the variability in the produced parts. The project team analyzed the process capability to identify the current stage cpk. Figure 8 shows the results of process capability. The current cpk is -0.53, which is very low than the ideal one.

2.2.3. Box Plot
The Box plot is a way to plot a set of data measured using a scale defined in intervals. The Box plot shows that 25% of the data lie between 0.08 to 0.14, while 50% lie between 0.14 to 0.19 and 25% lie between 0.19 to 0.22.

2.3. ANALYZE
Determining the true cause of the process concerns that would lead to improvements is the analyze stage of DMAIC. The collected data in the measure phase is also analyzed using multiple tools to pinpoint the root causes of the problems. The Analyze phase of the DMAIC process is critical as it helps uncover the issue’s root causes and establishes a strong basis for creating workable solutions in the Improve phase. After identifying a major issue in Pareto analysis, the statistical tool ‘histogram’ is used for data analysis. Multiple brainstorming sessions were conducted with the team & other concerned stakeholders to enlist the possible root causes of the problem. A cause and effect diagram was built as a result of these sessions, and problems were defined in Man, Machine, Material & Method, as shown in Figure 10. Some of the major causes defined are as follows:
- Wear out tools
- Play in Fixture
- No preventive maintenance
- Inappropriate part handling
- Variation in the machining process
- Quality of machining cutting tools
After enlisting potential causes, multiple solutions are discussed against each cause. These solutions are prioritized based on their potential impact and viability and should be supported by data and analysis.

2.4. IMPROVE
Identifying improvements or adjustments, verifying them, and implementing them to handle potential problems is necessary. During the Improve phase, efforts for Improvement highlighted during the Analyze phase are implemented. The intervention plan was made against all the issues, and improvements were suggested in the plan. Table 1 shows the intervention plan with the requirements to implement the interventions.
| S. No | Cause | Improvement Suggested | Document |
| 1 | Wear out tools | Preventive maintenance of the machine | Tool replacement check sheet Tool inspection check sheet |
| 2 | Play in Fixture | Preventive maintenance of the machine | Preventive maintenance plan |
| 3 | Movement in Hydraulic jack | Preventive maintenance of the machine | |
| 4 | Carbide inserts should be replaced with high-quality diamond inserts | Variation in the machining process | |
| 5 | Part mishandling | Employees training | Employee training plan |
| 6 | Quality of machining cutting tool | Carbide inserts should be replaced with high-quality diamond inserts |
2.4.1. Wear Out Tools
The Improvement suggested for wear-out tools is to set a tool replacement and inspection frequency. Wear-out tools were getting unnoticed and produced defective parts.
- Tool Inspection Frequency: The quality inspector will inspect tools before the start of production. A check sheet will be filled with all the checkpoints to ensure the tool is in a workable position.
- Tool Replacement Frequency: Tools will be replaced after production of every 3000 parts. The quantity will be monitored through a daily production sheet.
2.4.2. Play in Fixture/ Movement in Hydraulic Jack
A preventive maintenance plan was made to avoid breakdown maintenance. A plan was formulated, and after every 25 days, maintenance will be done.
2.4.3. Part Mishandling
Employees will be trained to handle parts properly, inserting the part in the fixture and removing it. A training plan was formulated for the workers, supervisors and inspectors.
2.4.4. Data Collection (after Improvement)
Flatness data after the machining process was taken at the Improvement. The sample size was 50 parts. The parts were selected randomly from the production every 15 mins so that the consistency of the process may be checked. Process capability analysis was done to check the performance and consistency of the process after Improvement.

2.4.5. Process Capability
After interventions, cpk was calculated, resulting in a positive side, which indicates that the process is within the required parameter; the cpk value achieved was 0.43, as shown in Figure 12.

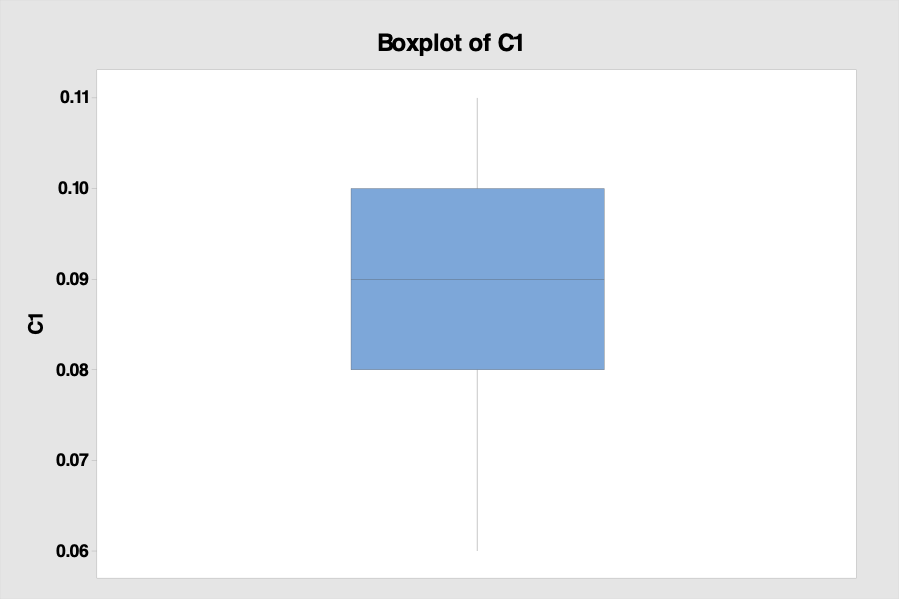
2.4.6. Box Plot
After improvement, the Box plot shows that 25% of the data lie between 0.06 to 0.08, while 50% lie between 0.08 to 0.10 and 25% lie between 0.10 to 0.11. Overall, it is clearly shown that 75% of the data lies between 0.06 to 0.1, which is the project’s target.
2.5. CONTROL
In the control phase, the emphasis is on implementing control measures to ensure the process is stable and stays within the desired bounds. The three main tasks of the control phase are putting controls in place, standardizing and integrating the finished process improvements, documenting the project, and summarizing it. The key steps are discussed below;
- Establish the metrics that will be used to ensure the process performance and make them in line with the project’s objectives.
- Establish control techniques to ensure the improvements are sustained over time. It should also have to identify and resolve problems and share outcomes.
- Document the results and share them with relevant stakeholders.
2.5.1. Implementation of Control Chart

2.6. LESSON LEARNED
During this project, we have learned that the Lean methodology also emphasizes the need to define clear goals. Results came more quickly. Our roadmap was in line with the aim. We can only do this if we define them precisely. We need to be specific about where we are right now and where we intend to go by the end of our target time frame.
Understanding the advantages of data-driven decision-making and a Six Sigma methodology helped us develop a more positive perspective. We Keep data at the center of our tools and processes for business improvement. Making informed business decisions requires having the appropriate amount of correct data. It is simpler, easier to assess, and less likely to go wrong to implement ideas when there are numbers available. We learned that prioritizing our customers is the best business expansion strategy. We won’t be able to endure and develop if we can’t satisfy our clients and keep them returning for more. Our commitment to providing consumers with exceptional service must be evident to us, and we must monitor it.
Our Services
We offer a comprehensive suite of Lean Six Sigma implementation services tailored to meet your organization’s unique needs. Our team of highly skilled and certified professionals collaborates closely with your staff to identify opportunities for improvement, design innovative solutions, and drive sustainable results. Leveraging our extensive industry expertise and proven methodologies, we provide end-to-end support through each phase of the DMAIC approach. From initial project scoping and data collection to advanced analysis, improvement strategies, and robust control mechanisms, we ensure a seamless and effective implementation of Lean Six Sigma principles. As your trusted partner, we are dedicated to empowering your organization with the tools, knowledge, and guidance necessary to achieve lasting operational excellence and a competitive edge in the marketplace.
Don’t hesitate to reach out and discover how our exceptional Lean Six Sigma implementation services can elevate your organization to new heights of efficiency and success – contact us today!


4M Analysis Process: Root Cause Guide for Manufacturing
Learn how to use 4M Analysis to find manufacturing root causes across People, Machine, Method, and Material with diagrams, examples, and checklist.


amazing information
Very useful, how we can get the file?
What file are you referring to?
I tried downloading the file, but it says error. Can you please send me the file?
Please share it