
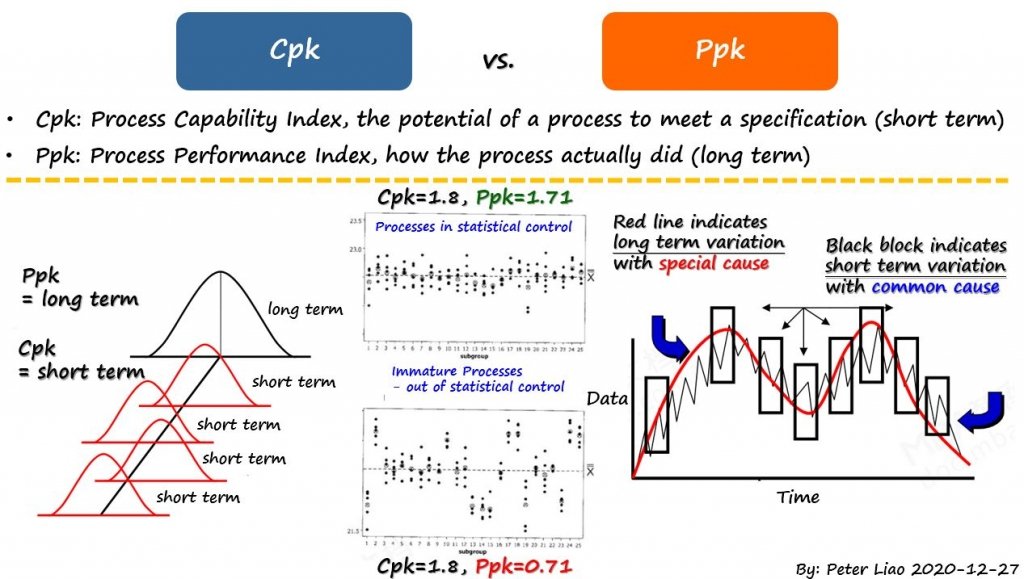
Cpk vs Ppk is one of the most common sources of confusion in manufacturing quality. Both metrics compare your process output to customer specification limits, but they answer different questions.
Cpk is usually used to describe what the process is capable of doing when the process is stable and the variation estimate comes from within-subgroup variation. Ppk describes how the process actually performed over the selected data set using overall variation.
In simple terms: Cpk is closer to potential capability. Ppk is closer to observed performance. For a deeper capability foundation, see Process Capability and Statistical Process Control.
Quick comparison: Cpk vs Ppk
| Question | Cpk | Ppk |
|---|---|---|
| Meaning | Process Capability Index adjusted for centering. | Process Performance Index adjusted for centering. |
| Variation used | Within-subgroup variation, often treated as short-term process variation. | Overall variation from the full data set. |
| Main use | Estimate process potential when the process is stable. | Summarize actual process performance over a period of time. |
| Best condition | Use after confirming statistical control. | Use to understand what happened in the data collected. |
| Typical message | “What could this process do if it stays stable?” | “What did this process actually deliver?” |
What is Cpk?
Cpk stands for Process Capability Index. It adjusts Cp for how well the process is centered between the lower specification limit and upper specification limit. A process can have a good spread but still have a poor Cpk if the average is too close to one specification limit.
Cpk is most useful when the process is in statistical control. If the process is not stable, Cpk can create false confidence because the future process may not behave like the short-term variation estimate suggests.
What is Ppk?
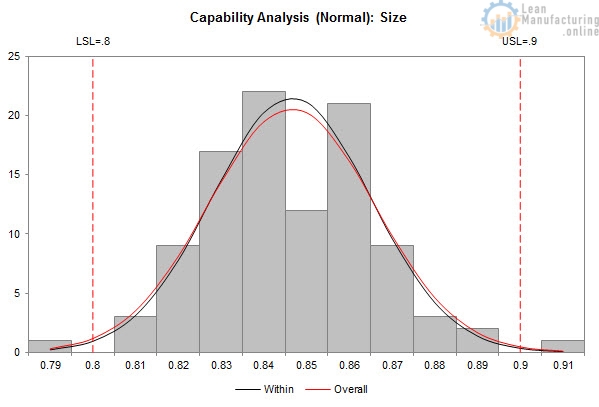
Ppk stands for Process Performance Index. It also adjusts for centering, but it uses the overall standard deviation from the selected data set. That means Ppk includes more of the total variation that actually occurred during the measured period.
Ppk is useful when you want to describe how the process performed historically. It is especially helpful when the process may include shift-to-shift variation, setup variation, material variation, operator variation, batch variation, or special-cause movement.
Cpk and Ppk formulas
| Metric | Formula | What it uses |
|---|---|---|
| Cp | (USL - LSL) / (6 × σwithin) |
Specification width compared to within-subgroup spread. |
| Cpk | min[(USL - Mean) / (3 × σwithin), (Mean - LSL) / (3 × σwithin)] |
Within-subgroup spread and process centering. |
| Pp | (USL - LSL) / (6 × σoverall) |
Specification width compared to total observed spread. |
| Ppk | min[(USL - Mean) / (3 × σoverall), (Mean - LSL) / (3 × σoverall)] |
Overall spread and process centering. |
Why centering matters
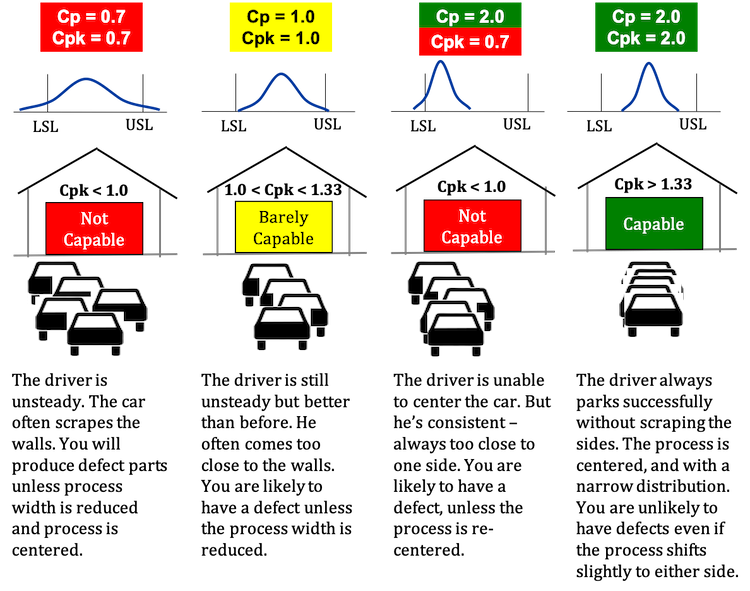
Cp and Pp look only at spread. Cpk and Ppk also look at where the process average sits between the specification limits. This is important because a process can be narrow but still too close to one limit.
That is why Cpk and Ppk use the smaller side of the process distribution. The weaker side is the risk side.
Simple manufacturing example
Imagine a shaft diameter with a lower specification limit of 9.90 mm and an upper specification limit of 10.10 mm. The process average is 10.02 mm. The within-subgroup standard deviation is 0.025 mm, while the overall standard deviation is 0.035 mm.
| Calculation | Result | Interpretation |
|---|---|---|
| Cp = 0.20 / (6 × 0.025) | 1.33 | The short-term spread looks capable. |
| Cpk = min(0.08 / 0.075, 0.12 / 0.075) | 1.07 | The process is not centered perfectly; the upper side is the risk side. |
| Pp = 0.20 / (6 × 0.035) | 0.95 | The overall performance spread is too wide. |
| Ppk = min(0.08 / 0.105, 0.12 / 0.105) | 0.76 | The actual observed performance is weaker than the short-term potential. |
In this example, Cpk is higher than Ppk. That usually means the process has extra variation over time that is not visible in the short-term within-subgroup estimate.

When should you use Cpk?
Use Cpk when the process is stable, the data collection method is correct, and you want to understand the process potential. Cpk is useful after control charts show that the process is not being driven by special causes.
Cpk is often used during validation, process improvement, supplier qualification, and customer capability reporting. However, it should not be used as a shortcut around SPC. A capability number without stability evidence can be misleading.
When should you use Ppk?
Use Ppk when you want to describe actual performance over the data period. Ppk is useful for mixed production data, early studies, historical performance, customer complaints, batch-to-batch performance, or when you want to include all variation that occurred.
Ppk can reveal the impact of instability, drift, setup changes, material changes, operator differences, or uncontrolled special causes. If Ppk is much lower than Cpk, the process may look good in the short term but perform poorly over time.
How to interpret the gap between Cpk and Ppk
| Pattern | Likely meaning | Next action |
|---|---|---|
| Cpk close to Ppk | The short-term and overall variation estimates are similar. | Confirm stability and continue monitoring. |
| Cpk much higher than Ppk | The process may have drift, shifts, special causes, or between-subgroup variation. | Use control charts and root cause analysis. |
| Both are low | The process is not capable or not centered enough. | Reduce variation, center the process, or review specifications. |
| High Cp/Pp but low Cpk/Ppk | The process spread may be acceptable, but the average is too close to a limit. | Re-center the process and verify control. |

Common mistakes with Cpk and Ppk
- Calculating Cpk without checking control: capability should not replace control charts.
- Mixing data sources: different products, cavities, tools, lines, or suppliers can distort the result.
- Ignoring measurement error: a weak measurement system can make capability look better or worse than reality.
- Using only one number: always review the histogram, control chart, subgrouping, and process knowledge.
- Forgetting centering: a process can have good spread but poor centering.
- Comparing studies with different sampling methods: Cpk and Ppk depend heavily on how the data was collected.
Before and after improvement
Capability analysis is powerful when it is used before and after improvement. Before improvement, the study shows the current gap. After improvement, the study confirms whether the process became more stable, more centered, less variable, or all three.

Capability study checklist
- Are USL and LSL correct and current?
- Is the measurement system acceptable? See Measurement System Analysis.
- Was the data collected from the correct process, product, cavity, tool, line, and condition?
- Was the process checked for statistical control?
- Is the subgrouping method meaningful?
- Are special causes separated from normal process variation?
- Are Cp, Cpk, Pp, and Ppk interpreted together?
- Does the team understand whether the issue is spread, centering, stability, or measurement?
How Cpk and Ppk connect to Lean Six Sigma
Cpk and Ppk are not just statistics. They help connect process behavior to customer requirements. In a DMAIC project, they can support the Measure, Analyze, Improve, and Control phases by showing whether a process is stable, capable, and improving.
Use 4M Analysis and Why-Why Analysis when capability results point to a real process problem. Use Quality Control and manufacturing KPIs to keep the improved process visible in daily management.

Read capability with process context
Cpk tells you what the process may be capable of when it is stable and evaluated with within-subgroup variation. Ppk tells you how the process actually performed over the data period using overall variation. When Cpk and Ppk disagree, do not argue about the formula first. Investigate stability, subgrouping, measurement system quality, centering, and sources of variation.
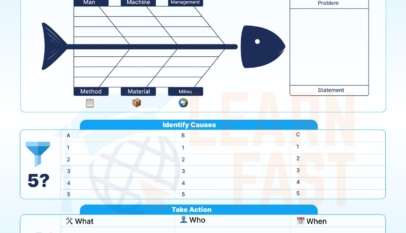



4M Analysis Process: Root Cause Guide for Manufacturing
Learn how to use 4M Analysis to find manufacturing root causes across People, Machine, Method, and Material with diagrams, examples, and checklist.


Very useful
Thank you its really usefull