The technique known as P-M Analysis was developed to compensate for these deficiencies in conventional cause analysis.
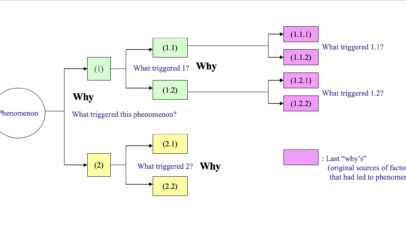
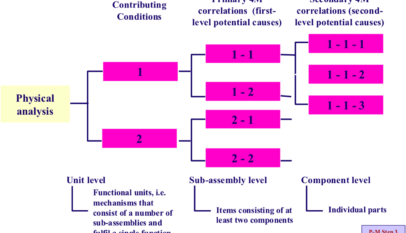
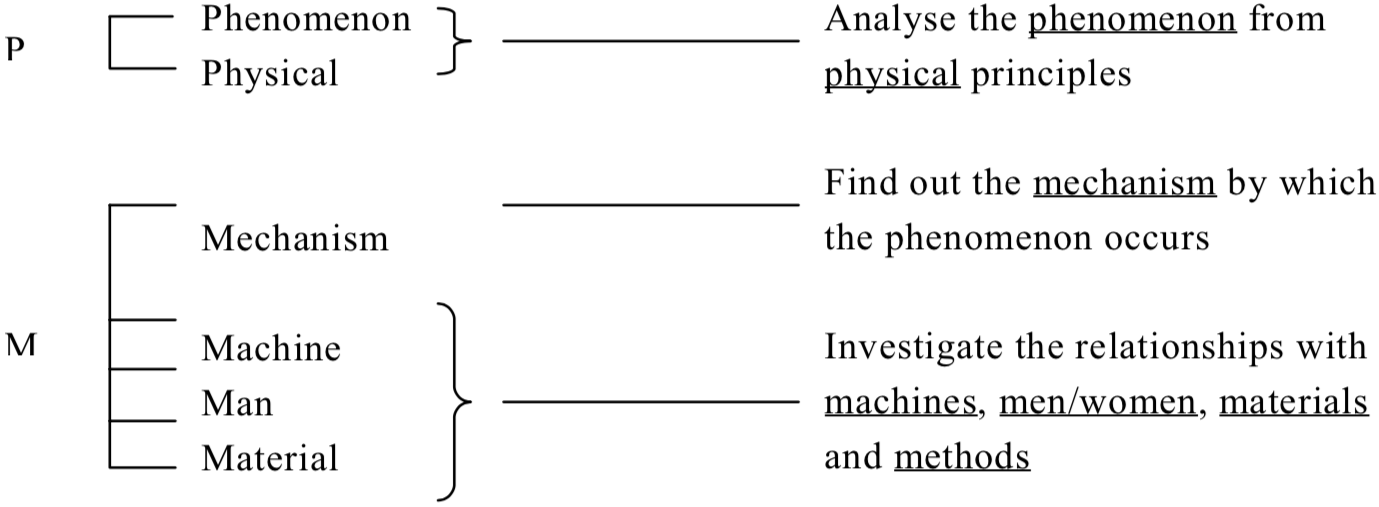
In P-M Analysis, the P and M do not stand for preventive or productive maintenance. As Figure “P-M Analysis” shows, the P stands for phenomenon and physical, while the M stands for mechanism, machinery, men/women, materials and methods. It is defined as an approach that elucidates the mechanism of a chronically occurring undesirable phenomenon by analyzing it in terms of the physical principles and parameters involved. Having identified the mechanism by which the chronic phenomenon (a chronic quality defect, breakdown or other loss) occurs, it goes on to list all the possible factors that could logically be thought to affect this mechanism, in terms of the machinery involved, the men and women who operate it, and the materials and methods used. It could also be described as a way of examining a situation analytically and systematically in order to eliminate a chronic undesirable phenomenon by reviewing the causal system, analyzing the causes and identifying and eliminating all relevant defects. The point is that P-M Analysis is not just another improvement tool; it is an entirely new way of examining and interpreting a situation.
Target-Setting: The Basic Approach to Improvement
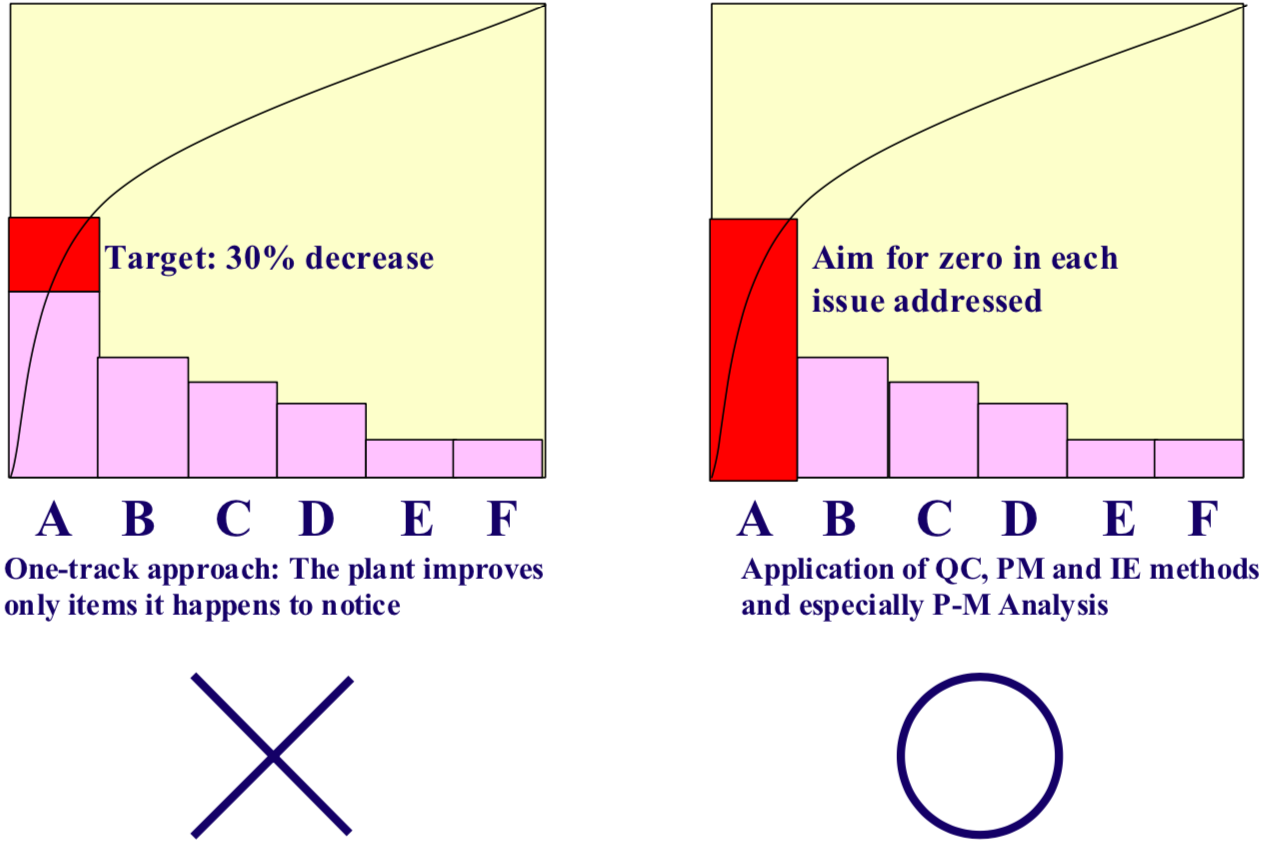
The first thing one usually notices when visiting companies that have not adopted TPM, and hear presentations on improvements they have made, is how low their targets have been set. This is true whatever the industry, size of the company, or type of operation. Typical examples would be a 30% reduction in quality defects, or a 20% reduction in changeover time, with the most ambitious targets being 50% reductions. Another common feature is jumping straight from the problem to the solution. It is often unclear why the particular solution was adopted, what the causes of the problem were, and what thought processes led to the solution.
To maximize the cost-benefits, improvement topics should be addressed in the order of the largest financial losses – that is, starting with the item on the far left of the Pareto chart. The projects should be prioritized in this way (see Figure “Target-Setting: The Basic Approach to Improvement”). However, it is important not to be satisfied with a conventional target of, say, a 30% reduction, but to aim to get rid of the problem entirely (i.e. to adopt the zero-focused approach). People may well start off by thinking that zero targets are unattainable, but many companies have demonstrated that they can in fact be achieved surprisingly often through the correct use of P-M Analysis.
