Step 5: Work out what the ideal state (the standard values and criteria) should be
The next step is to examine each of the possible causes of the phenomenon identified in the previous steps and establish a criterion for determining whether it is as it should be or not. As users of production machinery, we are very often not provided with any standards by which we can judge whether the equipment is in the condition it should be, in order to produce the required quality level in the product. In fact, at the component level, such standards are virtually non-existent. We, therefore, need to start by looking at the equipment operating manuals and installation records to find out what standards we do have (e.g. for levelness, vibration and other aspects of installation precision, or for parallelism, straightness, shaft runout and other aspects of assembly precision). To establish standards for other factors, we need to obtain detailed parts lists, assembly diagrams and other information or seek assistance from the machine’s manufacturer.
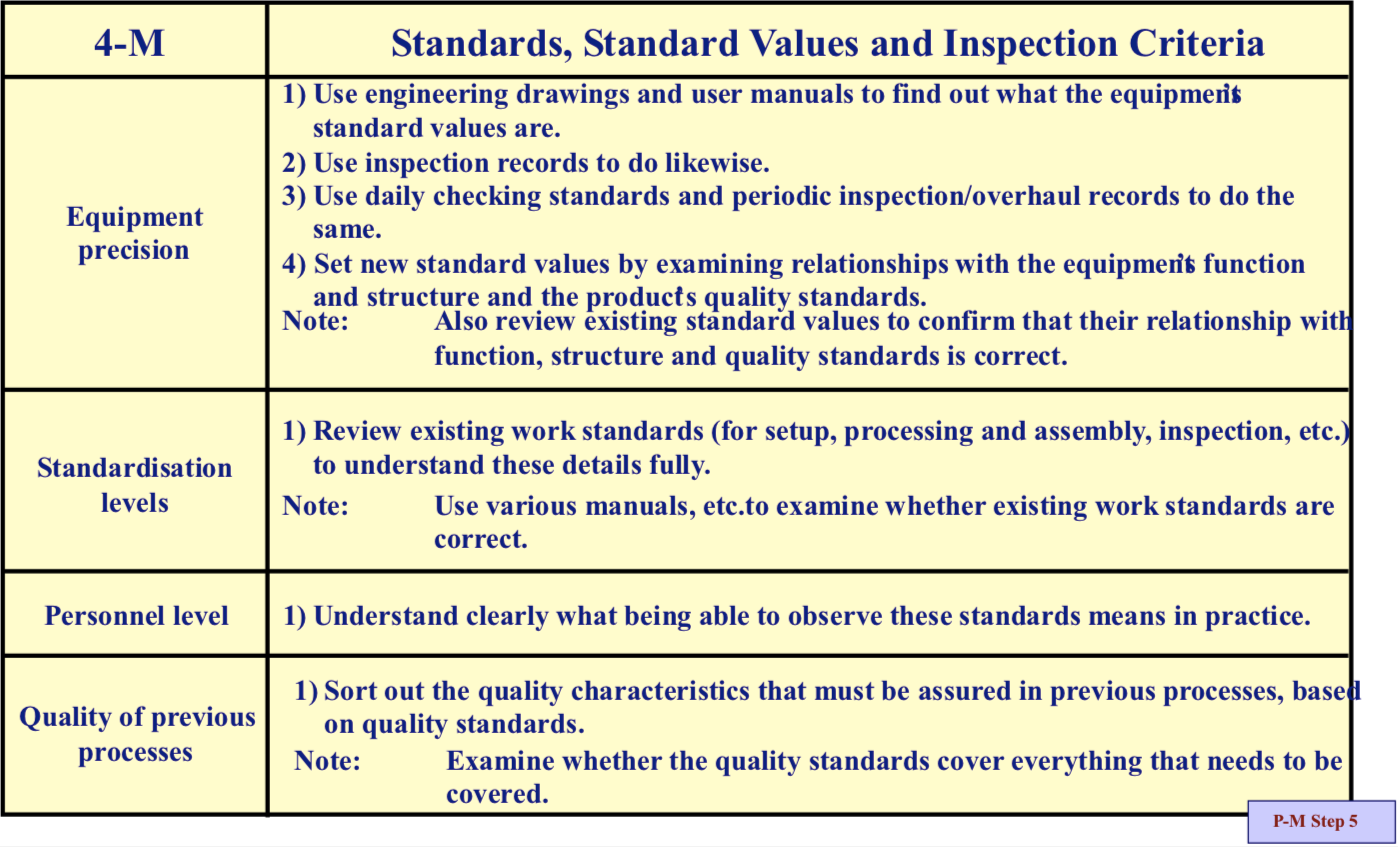
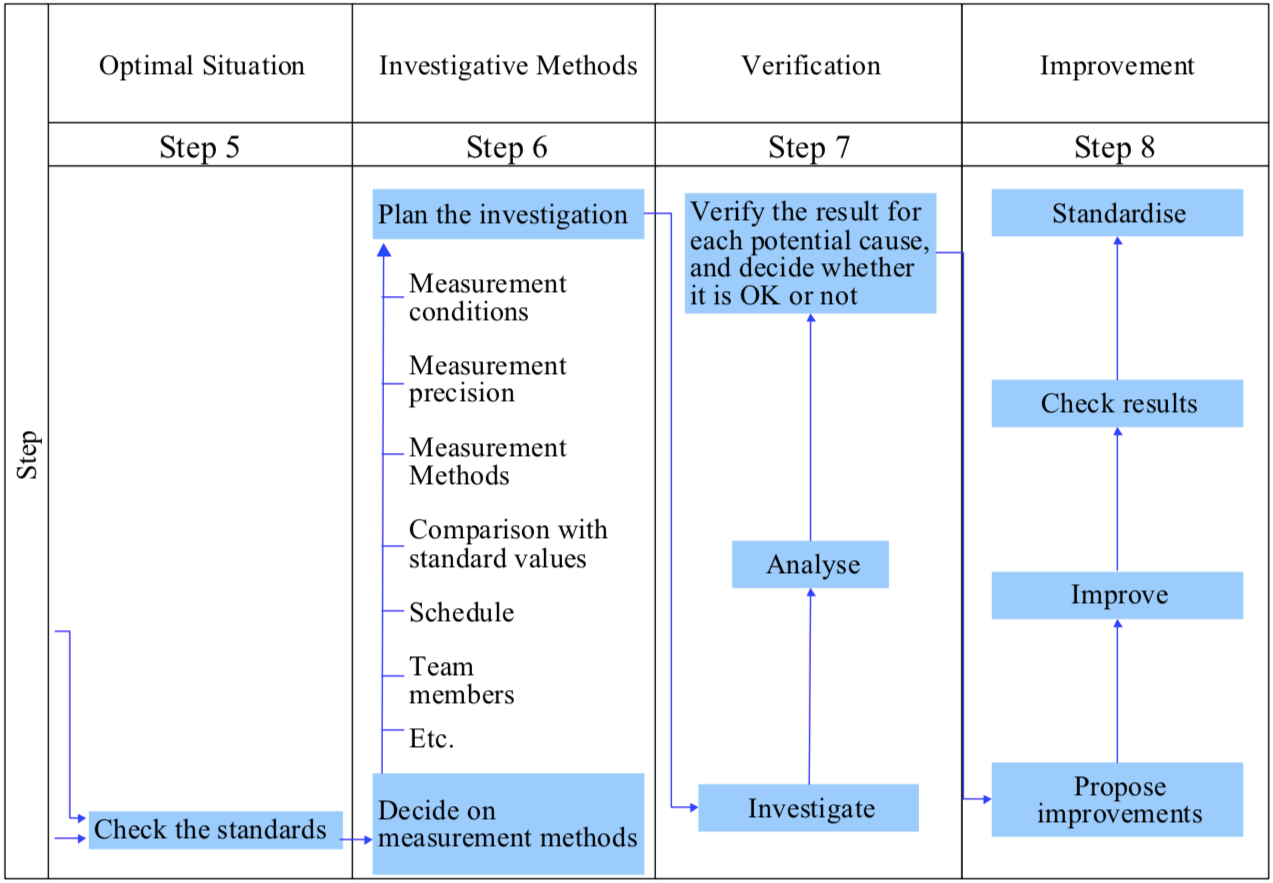
One practical way of establishing standards where none exist, particularly if there are many similar machines in the plant, is to measure the precision of the best-performing machine (the one with the highest process capability index, for example, or the one that turns out products with the greatest precision) and take that as a tentative standard. When specifying the precision of individual components, it is important to avoid qualitative expressions such as ‘not worn’ and try to use quantitative expressions such as ‘not worn by more than 10 μm’. Figure “Step 5: The 4 Ms in Relation to Standards and Criteria” summarises the key points for establishing standards, standard values and inspection criteria for equipment, methods, people and materials.
Step 6: Consider what investigation methods to use
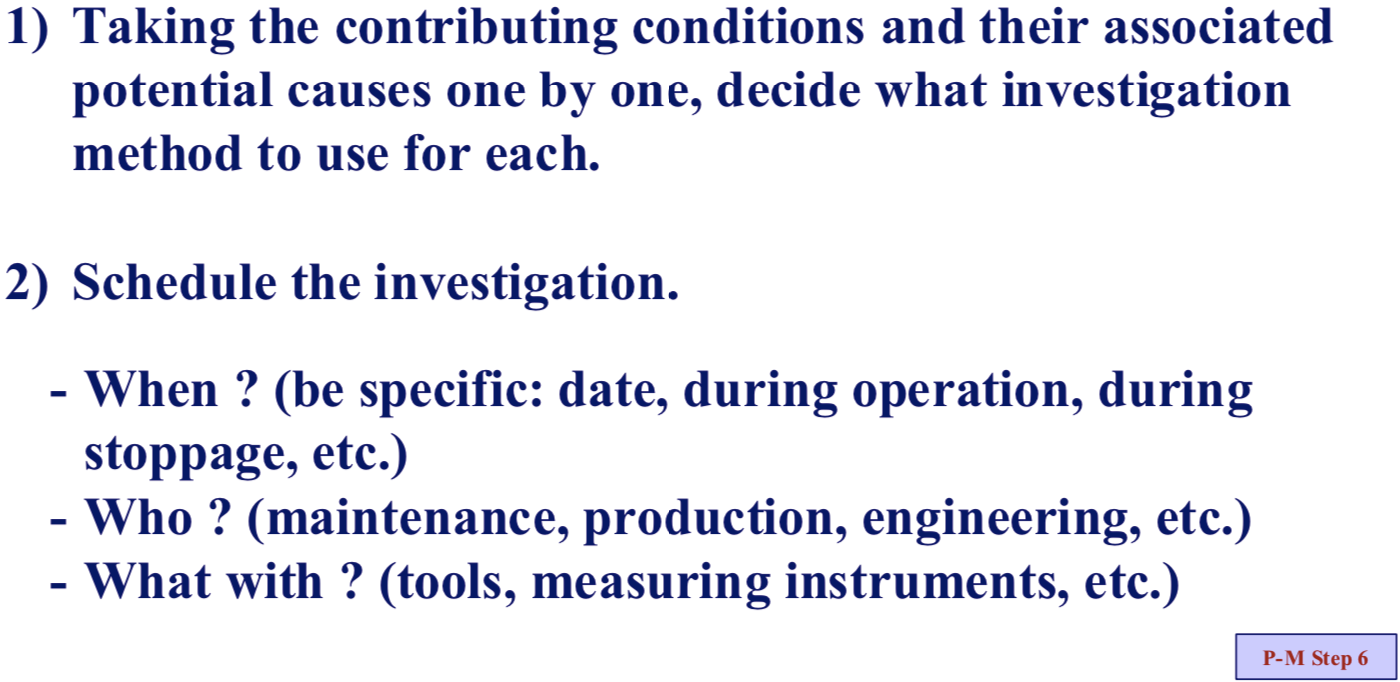
Here, we work out exactly how we are going to investigate and measure each causal factor. We decide what to measure, how to measure it, and what we are going to use as a reference plane if we are measuring dimensions. When doing this, we may find that we have no idea how to measure a particular factor, but there is always someone, somewhere who does, so it is important to cast the net wide. The activity can also give a tremendous boost to the company’s level of metrological expertise. As Figure “Step 6: Key Points for Deciding on Investigation Methods” indicates, we need to decide the When?, Who? and How? (or What with?) of carrying out the necessary measurements on all the potential causes of the phenomenon.
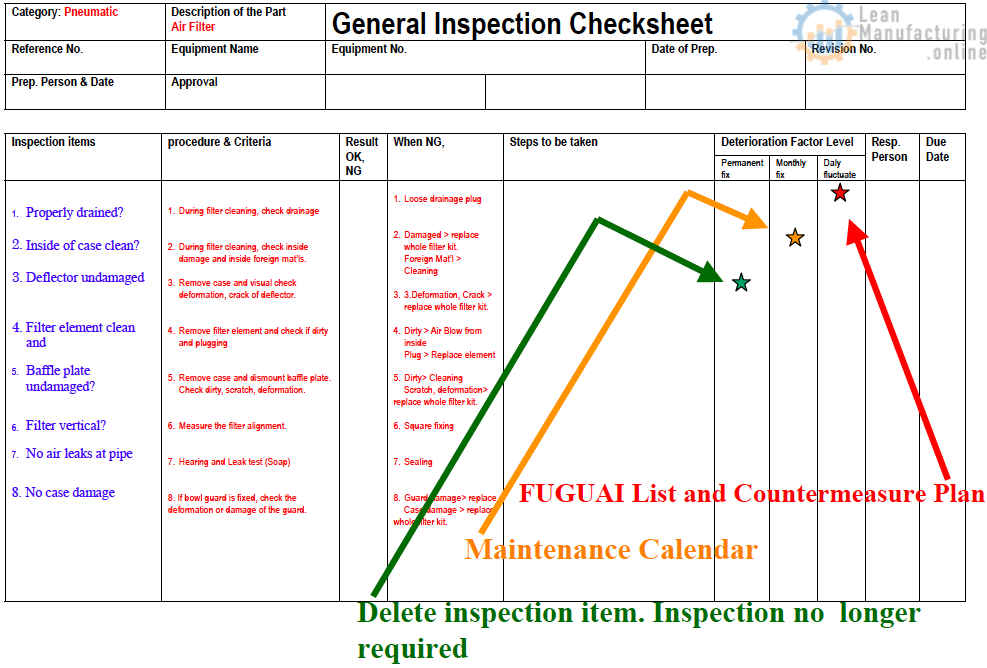
Step 7: Identify abnormalities (fuguai)
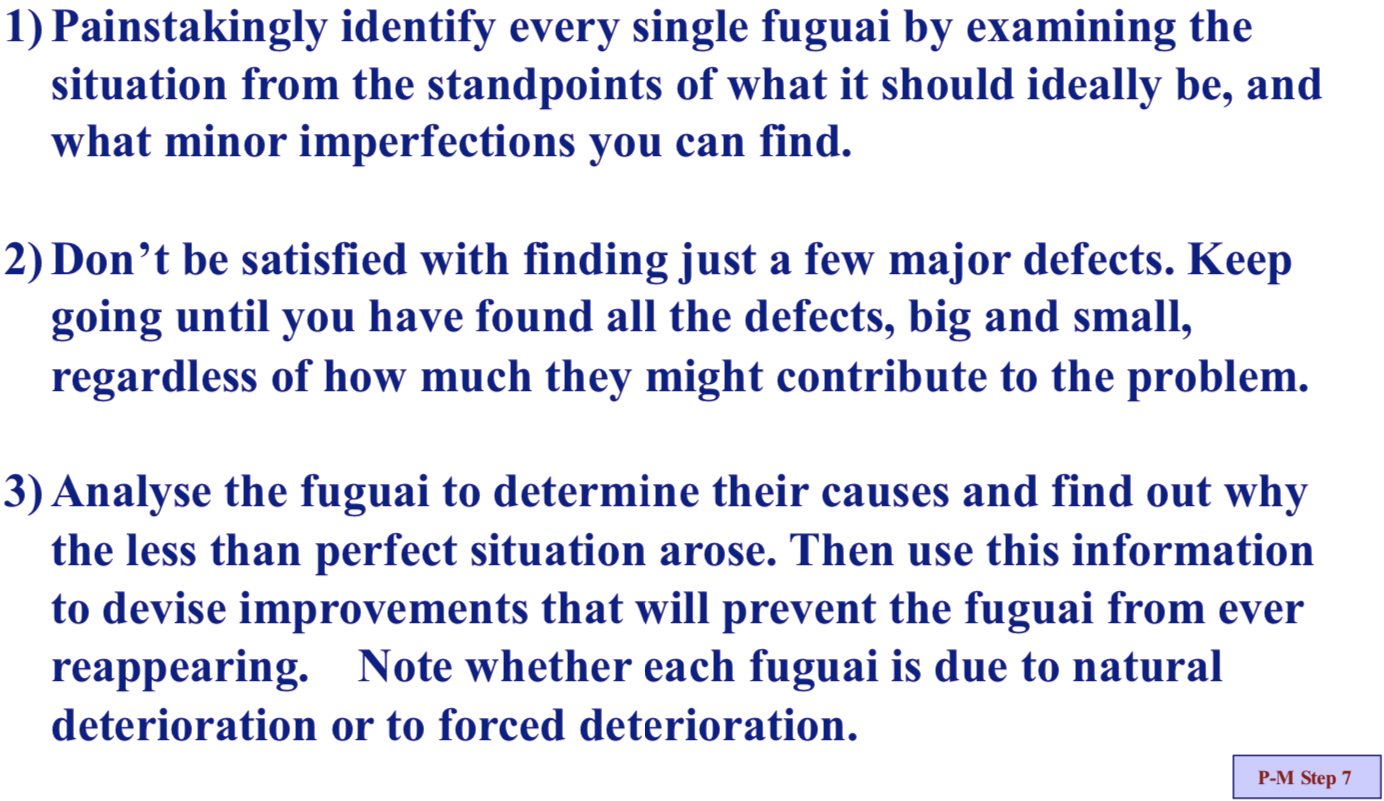
Identifying abnormalities means looking at each of the causal factors, comparing their actual values against the standards we established in the previous step and seeing if there are any deviations. When performing the measurements, we must do everything possible to ensure the results are reliable, e.g. by using instruments whose precision matches the tolerances we are trying to measure (if the tolerance is 0.01 mm, for example, we need an instrument that can measure in 0.002 mm units), and by establishing clear reference surfaces and measurement points. Figure “Step 7: Key Points for Identifying Minor Defects (Fuguai)” shows the key points to bear in mind when looking for deviations from the standards (such deviations are also referred to as ‘deficiencies’, ‘minor defects’, or by the Japanese word ‘fuguai’, which means anything that is not as it should be and might cause a problem).
Step 8: Restore or improve; sustain and control
(1) Restoration and improvement
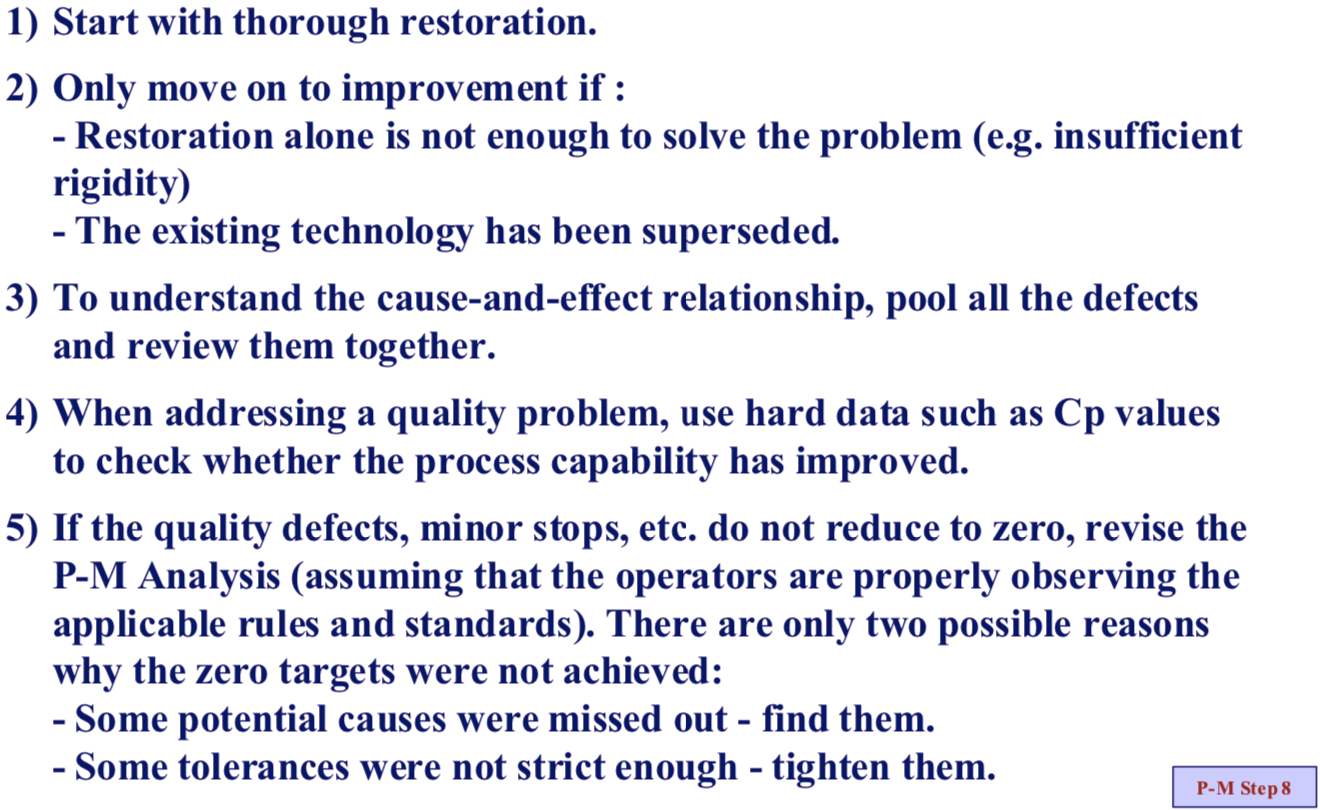
Restoring something means getting it back into its original, correct condition. Production equipment that has deteriorated should always be restored first before any improvement is attempted. However, improvements will be required if restoration cannot solve the problem (for example, if the machine has a structural weakness or is insufficiently rigid), or if it is technically outdated. Figure “Step 8: Key Points for Restoring and Improving” shows the key points for restoring and improving.
(2) Sustainment and control
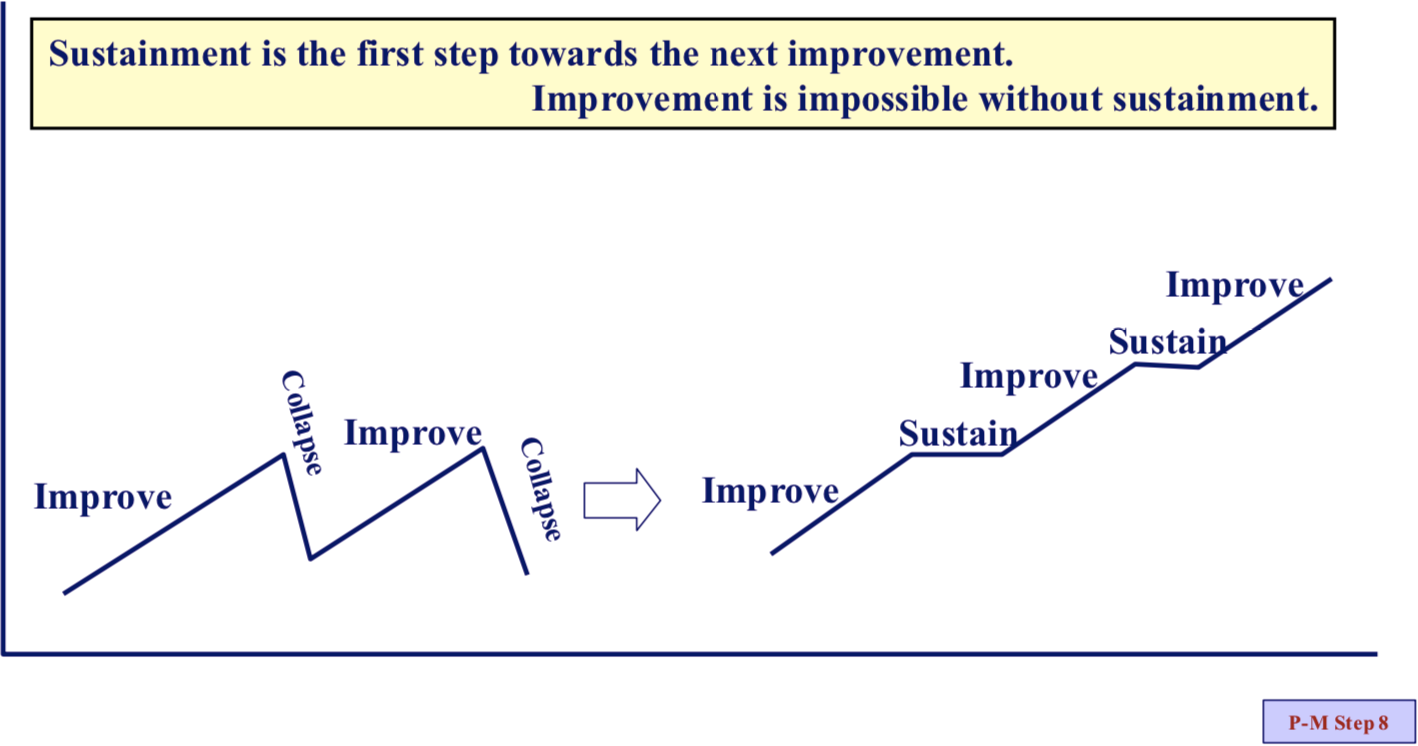
No matter how good an improvement may be, it will only produce useful results if it
is sustained, and making sure it is locked into place is the only way of securing a firm foundation on which to build the next level of improvement.
Figure “Step 8: The Importance of Sustainment” illustrates the importance of this idea.
To sustain improvements reliably and keep the situation under control, we need to do four basic things: (1) sort out what needs to be controlled (and hence what needs to be periodically checked), (2) consolidate the checks and reduce the time needed to carry them out, (3) establish zero-defect conditions and (4) monitor and sustain zero-defect conditions. These four aspects of sustainment will now be discussed.
1 Sort out what needs to be controlled
To maintain the improved situation after a successful P-M Analysis, we need to ensure that all the potential causes of the phenomenon are kept at all times within their allowable ranges.
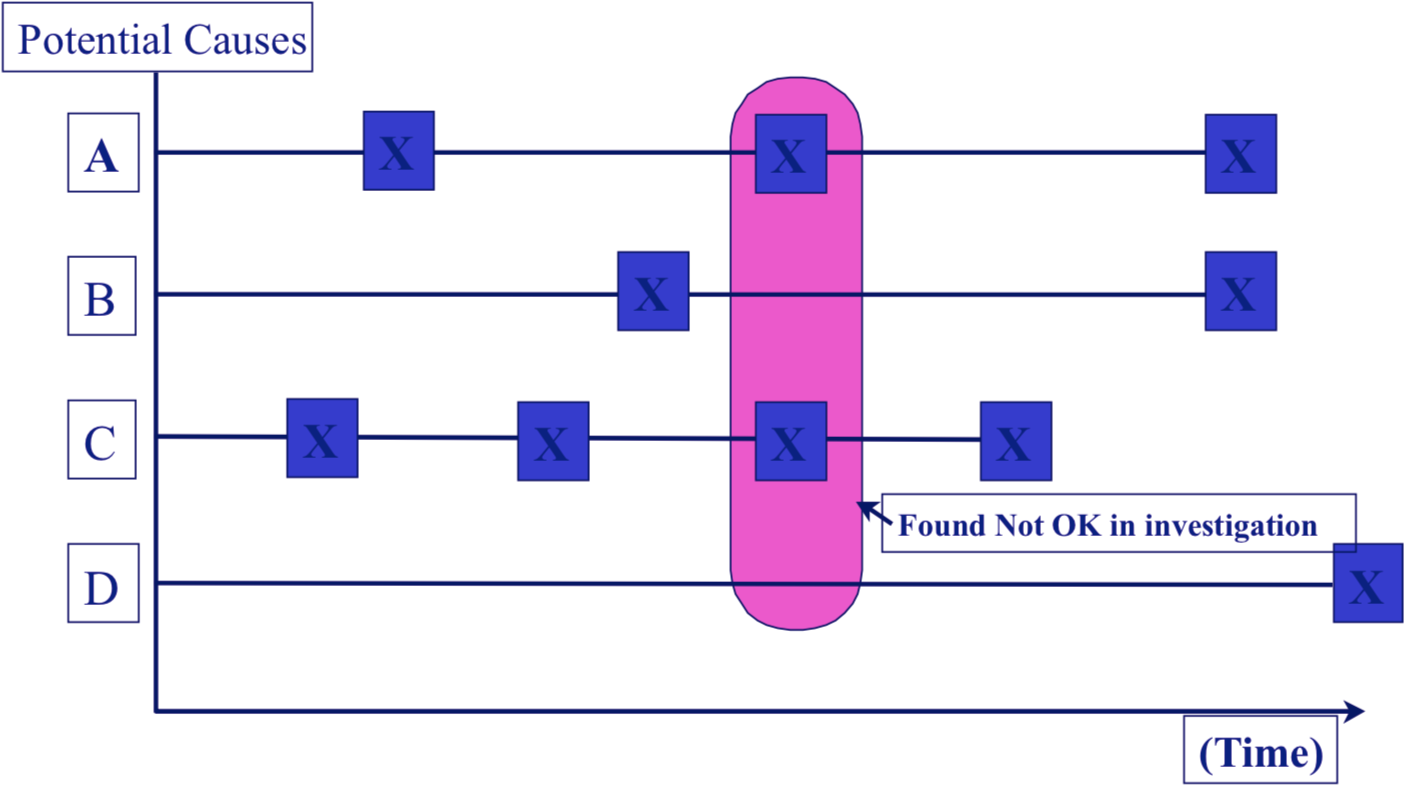
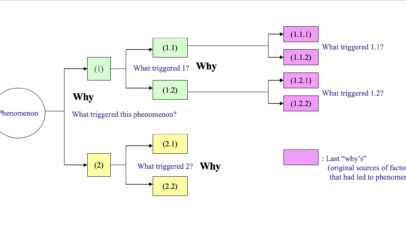
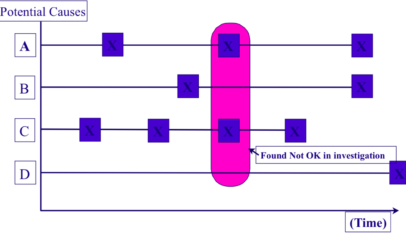
Although we tend to think that we only need to monitor the ‘Not-OK’ items (the potential causes that on the investigation were found to have deviated from the standard, and were, therefore, actual causes of the phenomenon) by incorporating them into the Autonomous Maintenance standards, this is wrong. It is wrong because it might just have been by chance that those particular items were outside their allowable ranges when they were measured, as shown in Figure “Relation between ‘Not-OK’ Items and MTBFs of Potential Causes”. There is no guarantee that the other items, the ones that just happened to be OK when measured, will stay that way for any length of time.
All of the potential causes identified in the P-M Analysis are therefore candidates for being monitored, but this does not mean that they all need to be. They should be classified as ‘fixed’ (unlikely to change), “semi-fixed” (liable to change, but only slowly) and ‘variable’ (liable to change at any time). The fixed ones do not need to be monitored, but the others do (see Figure “Three Types of Potential Cause”).
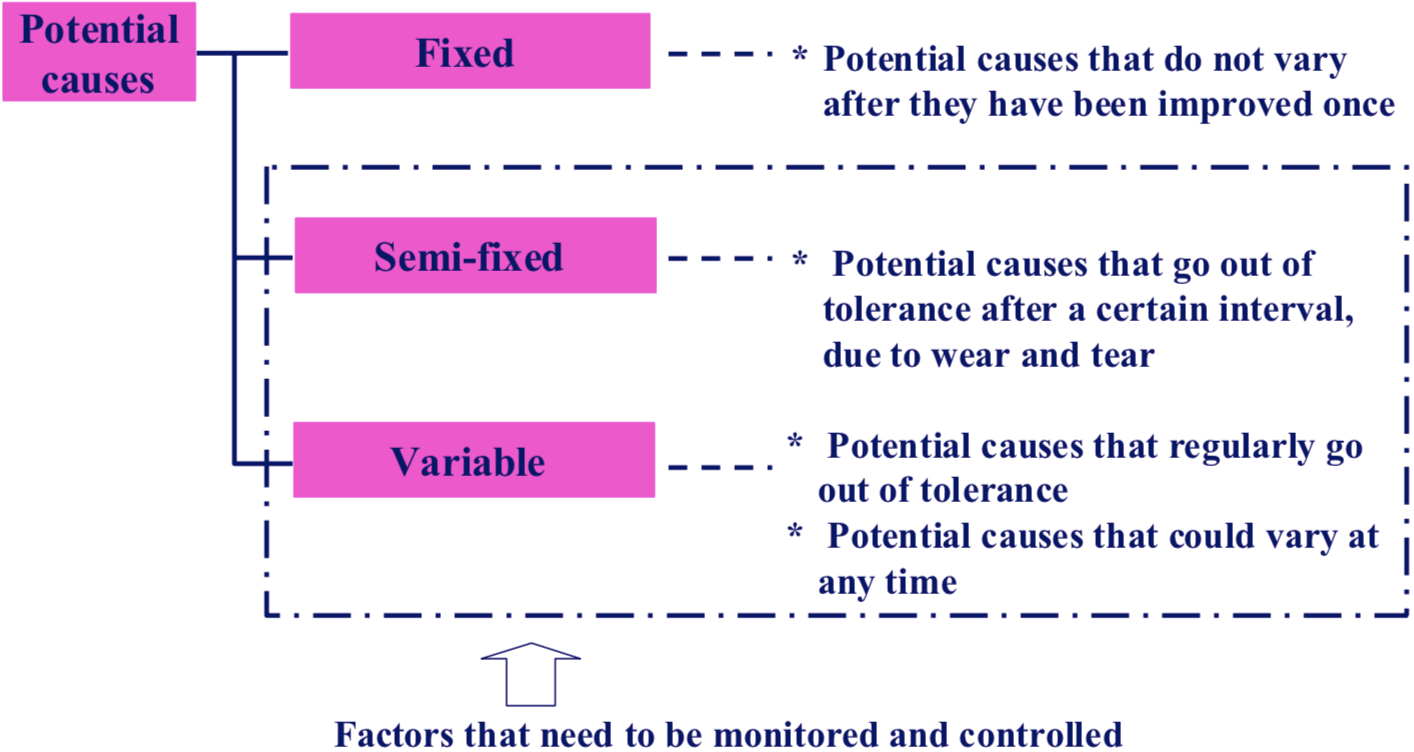
A fixed factor is a potential cause that, once improved, stays put (like a nut fitted with a locking device) and therefore need not be monitored. A variable factor is a potential cause that changes daily, regularly going outside its allowable range if not closely controlled. A semi-fixed factor is an intermediate between a fixed factor and a variable one; it is a potential cause that changes over a certain interval owing to wear and tear (such as a cutting-tool tip or a workpiece holder) and eventually goes outside its allowable range. A potential cause that is fixed when the equipment is new may turn into a semi-fixed one after time if the equipment deteriorates, necessitating regular replacement.
2 Consolidate and shorten checks
Since many of the potential causes of problems identified in the P-M Analysis will need to be monitored and controlled (the semi-fixed and variable ones), the workload of operators and maintenance engineers increases. In fact, the more thorough the P-M Analysis, the more new checks will be identified. Improvement team members tend to think they have done their job if they build the checks into the inspection standards. However, while the result may indeed be a wonderful set of standards, they will be of little use if they are too burdensome for the operators and maintenance engineers to apply.
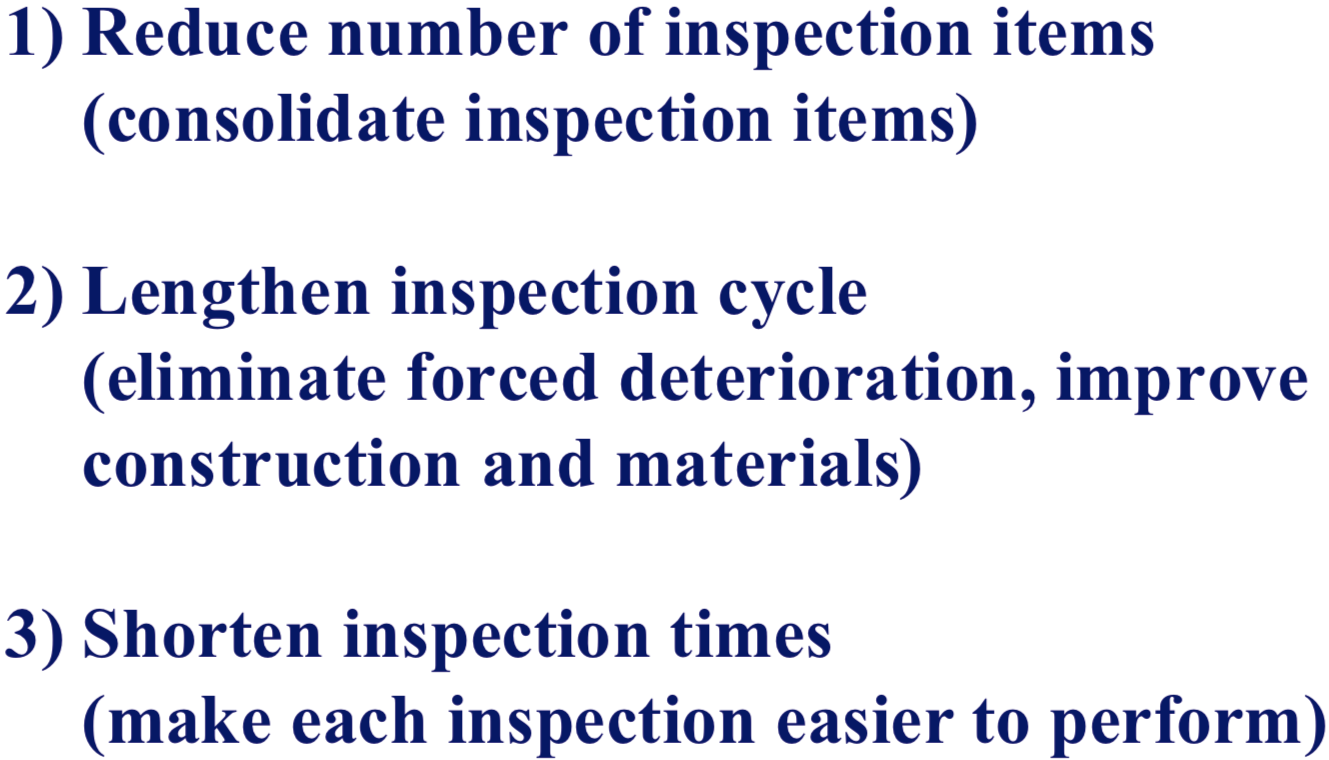
Resources are limited, so to enable us to reliably sustain and control everything that we need to, we must minimize the time and effort required. This means that we must fix as many of the potential causes as we possibly can. It is absolutely crucial to do as many improvements as possible to turn variable factors into semi-fixed factors, and semi-fixed factors into fixed ones. On top of this, we must also reduce the time and effort required to perform the checks by reducing their number, extending the intervals between them, and making them easier (and hence quicker) to complete (see Figure “Consolidating Inspection Items and Shortening Inspection Times”).
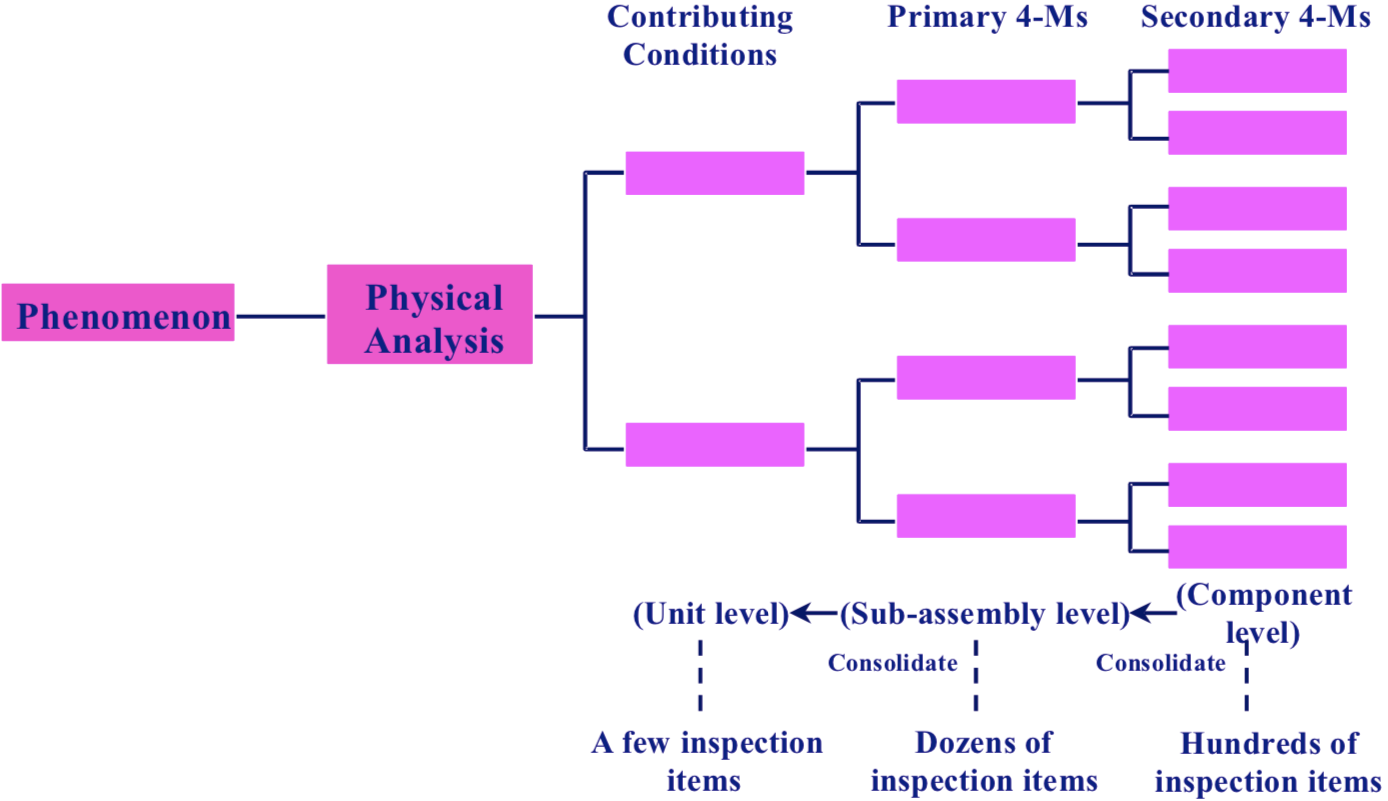
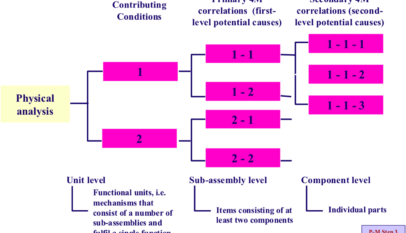
To minimize the number of checks that have to be carried out, we should try to establish checks as near to the beginning of the P-M Analysis as possible, looking first to see if we can do so at the level of the contributing conditions, and then moving down to the primary 4-M level and so on (see Figure “Consolidating Inspection Items”). We can also consolidate checks by monitoring groups of potential causes through parameters such as vibration values, and modify equipment to make static precision checks easier to perform.
3 Establish zero-defect conditions (prepare QM Matrices)
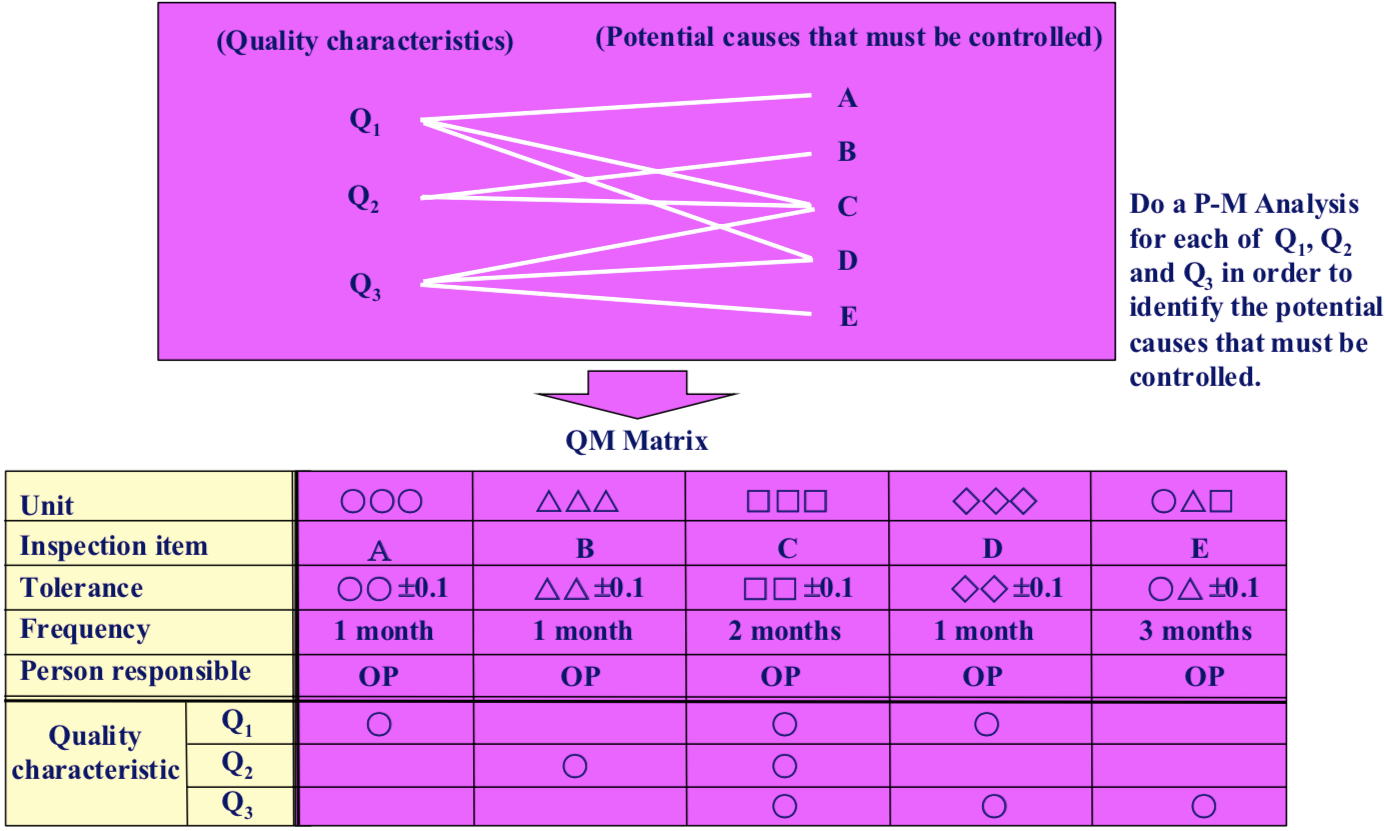
To ensure that the checks can be carried out easily and without any omissions, the relationships between the quality characteristics of the product and the 4 Ms for each piece of equipment should be plotted on a QM Matrix as illustrated in Figure “QM Matrix for Zero-Defect Equipment”. As the figure shows, a QM Matrix relates the quality characteristics (Q – down the side) to the 4-M conditions that must be controlled (M – across the top), using circles in the relevant cells to show where relationships exist.
4 Monitor and sustain zero-defect conditions (monitor deterioration trends and perform daily checks)
Some of the items to be checked that are identified on the Q-M Matrix will deteriorate as the machine’s hours of operation accumulate (for example, a part may be subject to progressive wear). The measured data for these items should be plotted on a graph at predetermined intervals in order to monitor the deterioration trend. Other variable factors should be included in Autonomous Maintenance standards or in the maintenance department’s periodic maintenance standards and checked on a routine basis.
Points to Note when Carrying out a P-M Analysis
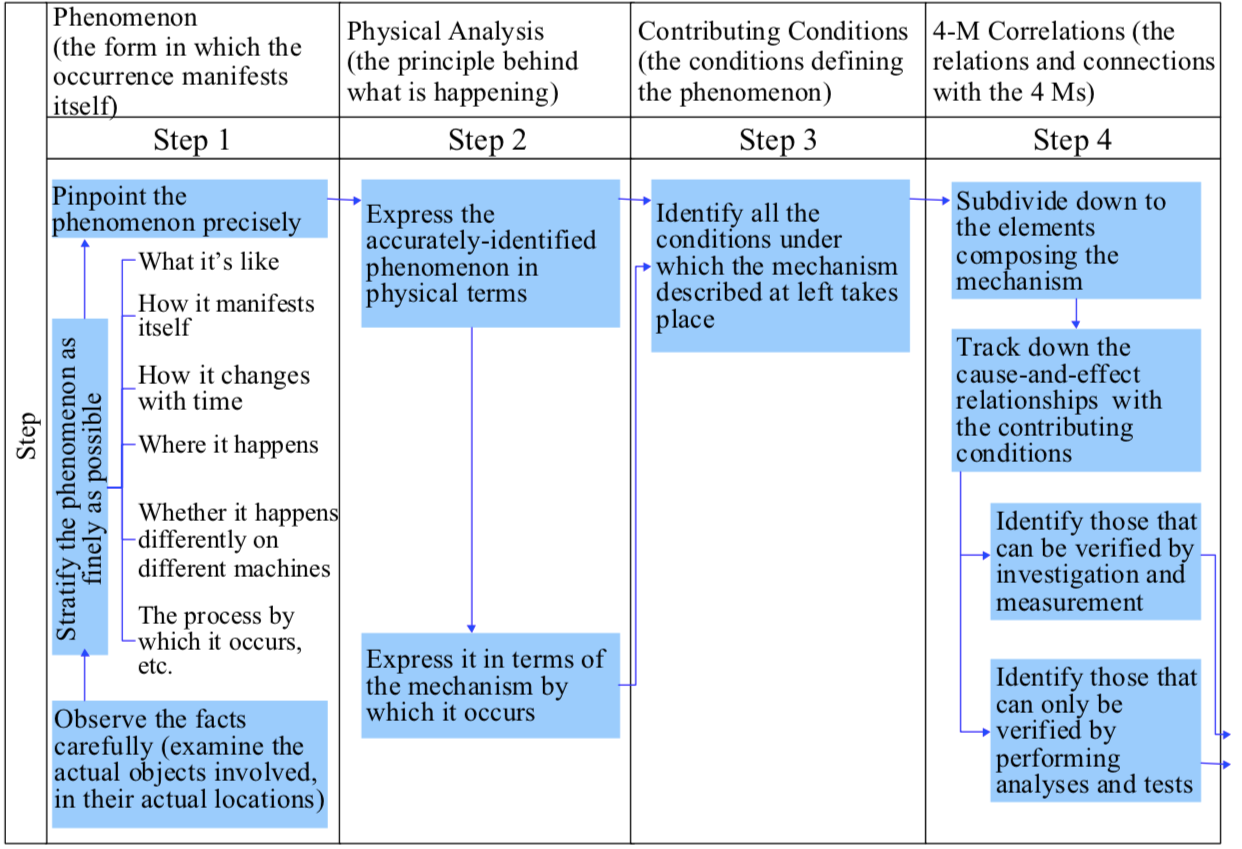
Each of the steps of P-M Analysis has now been explained, together with the important points to bear in mind at each step. Figure “P-M Analysis Steps and Key Points” summarises these points.


4M Analysis Process: Root Cause Guide for Manufacturing
Learn how to use 4M Analysis to find manufacturing root causes across People, Machine, Method, and Material with diagrams, examples, and checklist.


