SECTION 3
SCM AS TPM LEVELS 2 AND 3
- LEVEL 2 AND 3 GENRES AS SEEN IN THE TPM AWARDS
- THE STRENGTHS AND LIMITATIONS OF TPM
- AN EXAMPLE OF THE INTRODUCTION OF SCM AS
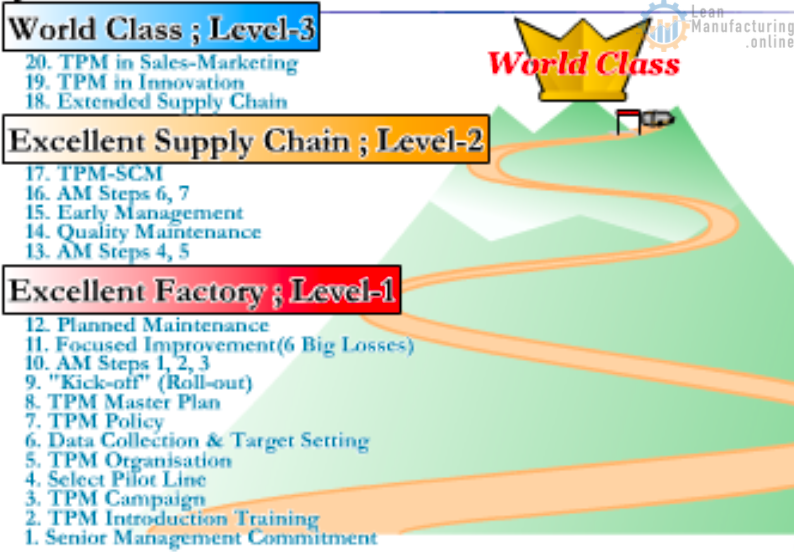
THE DIRECTION OF TPM LEVELS 2 AND 3
- Deepening of production technology (focusing on the manufacturing process)
- Shifting towards product development
- Creating new value by restructuring the business (downsizing existing businesses)
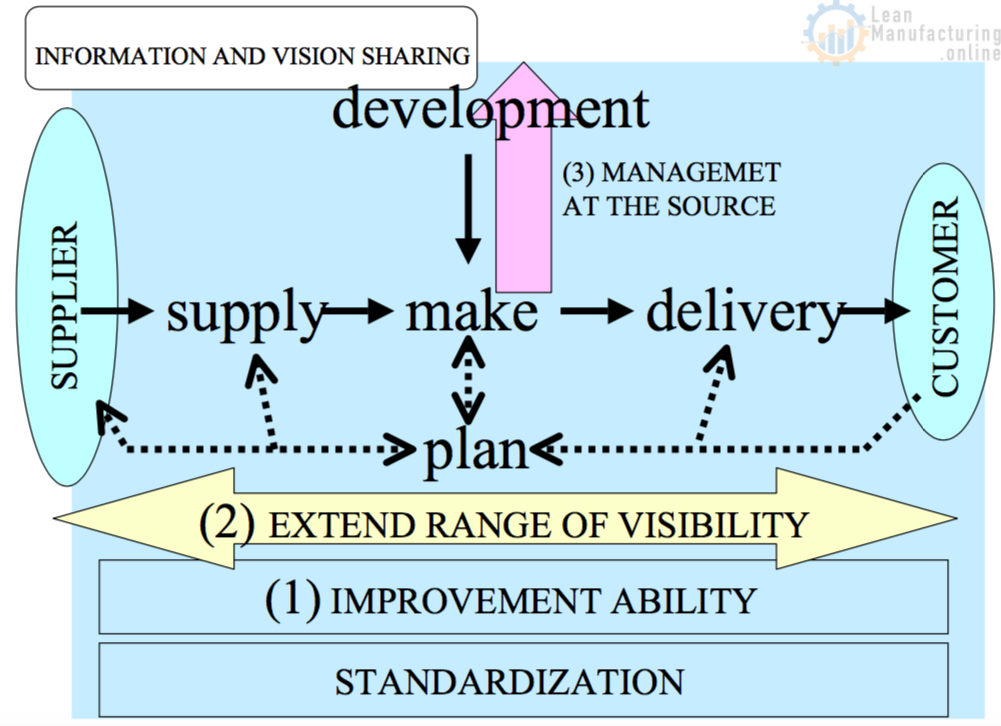
- Extending TPM into the supply chain (a natural development that extends the range of visibility, but…)
TOC VIEW OF JAPANESE-STYLE MANAGEMENT (JIT, TQC, AND TPM)
- Japanese-style management lacks overall optimization and management of a company’s progress towards its goals :
It borders on the throughput realm, since it reduces inventories through JIT, minimizes variance by improving quality through TQC, and reduces costs through TPM, but restructuring aimed at reducing expenditure is far more effective
- It is unrealistic to deny the existence of Murphy’s law
(Zero inventory, zero quality defects, recurrence prevention) - It does not make effective use of constraints; basically, it is working in the cost realm
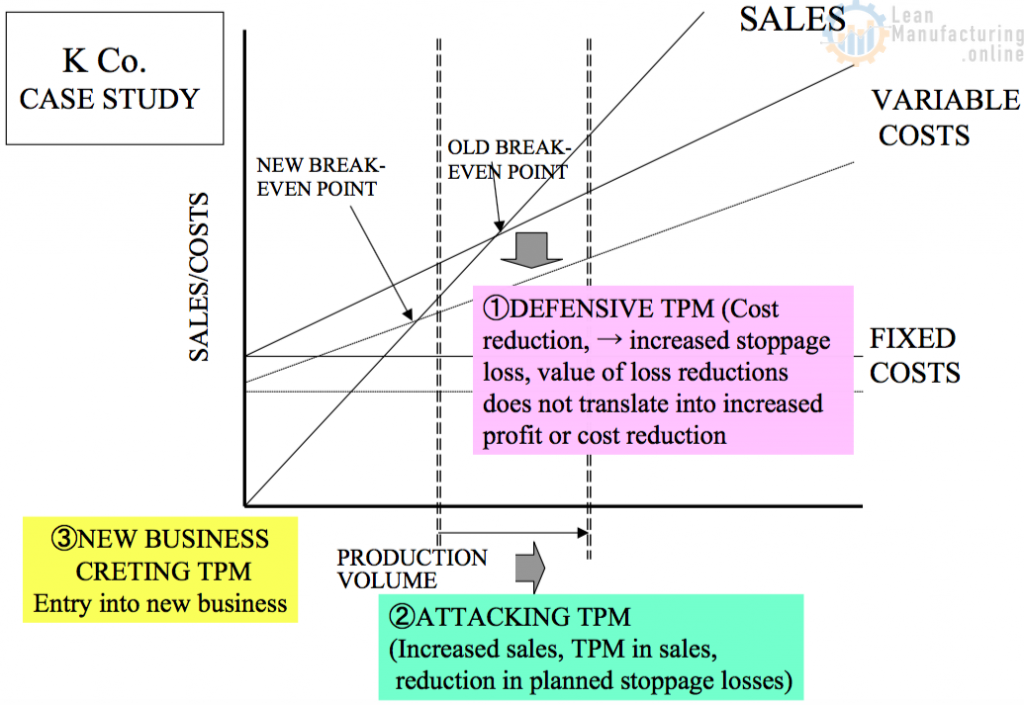
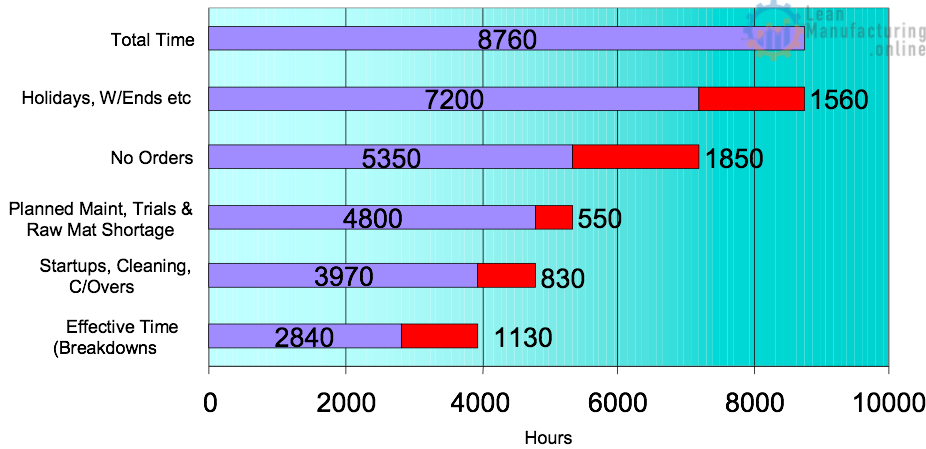
LOSS REDUCTION AND COST REDUCTION IN TPM
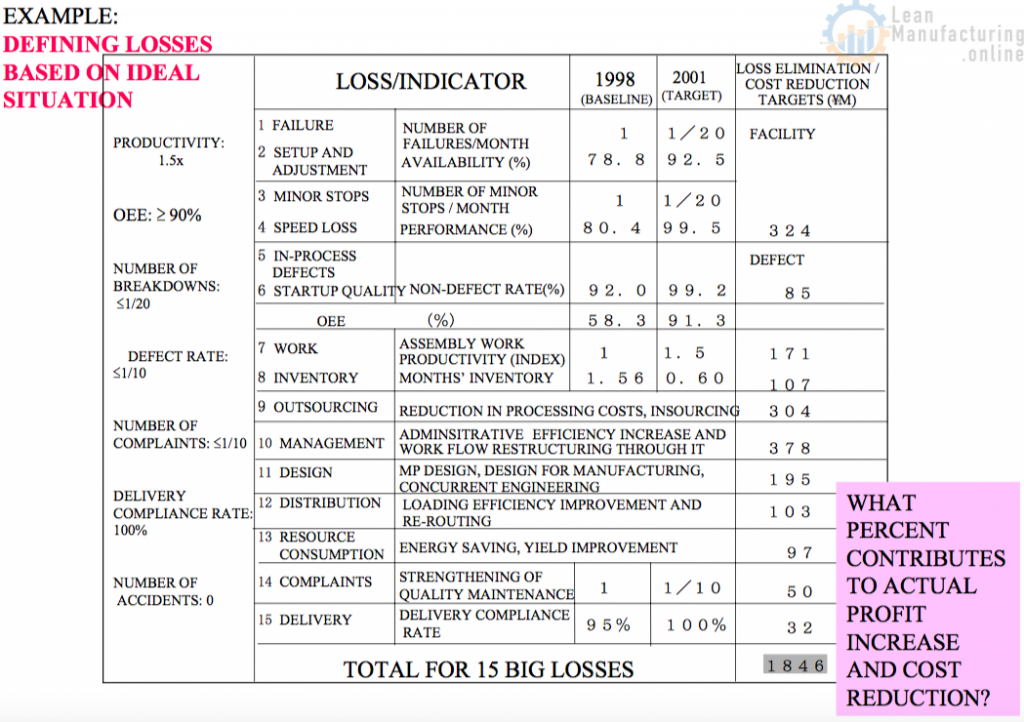
CREATING ACTUAL PROFIT WITH IMPROVEMENT ACTIVITIES IN TPM
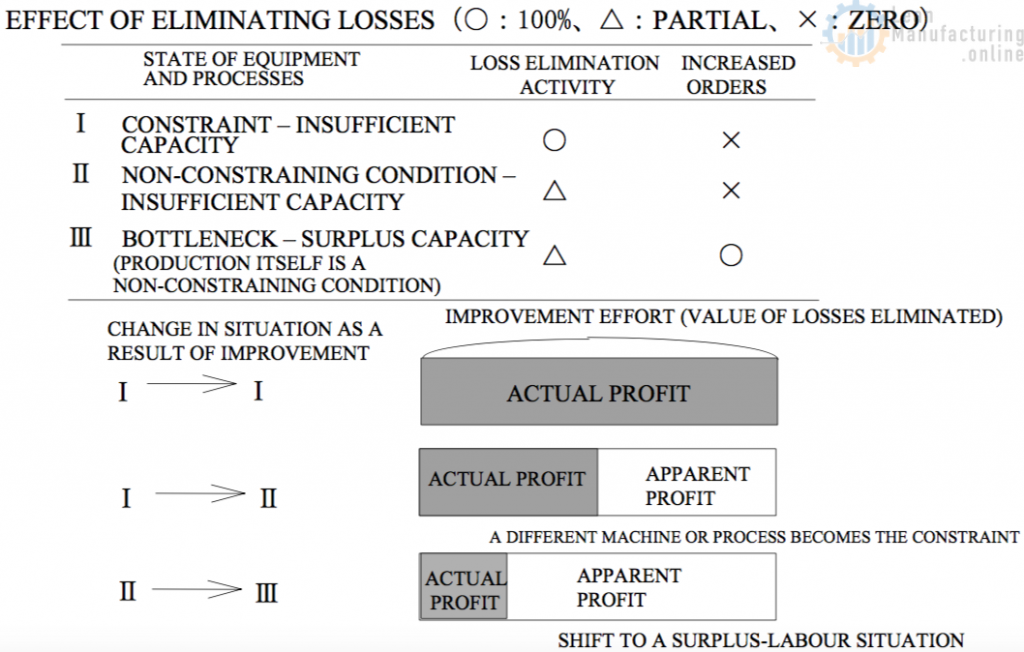
CONSTRAINTS ARE CONSTANTLY CHANGING A TPM PROGRAM TAILORED TO THE SITUATION
- Conventional loss-elimination principles like aiming at over 85% OEE tacitly have a situation I as their precondition
- In situation II, it is important to predict the constraints and prioritize the loss-elimination activities
- In situation III, the constraint lies outside production (e.g. In sales), and it is essential to link the TPM program with this
- Constraints are constantly changing, and sharing the information on this objectively and systematically will be an essential requirement for managers and support staff from now on. 90% of a company’s constraints are non-transparent policy constraints (market and organizational issues)
REDUCTION OF FIXED COSTS (NO-TOUCH OPERATION)

EXAMPLE OF TPM TAKING RETAIL OUTLETS AS ITS STARTING POINT (C Co. Case)
• Pursue of freshness (time reduction until consumer consumption & quality improvement by material suppliers management)
• Reduction in inventory and lead-time to consumer (freshness) through the extension of the range of visibility (from plant to distribution, delivery, and retail outlets)
• Shift to TPM with sales as the main player (evaluation yardsticks: actual demand capture rate and retail outlet activation via wholesalers)
• On the upstream side, quality improvement through increased visibility and coordination from raw materials production through to product manufacture
Visual management throughout the supply chain

SECTION 4
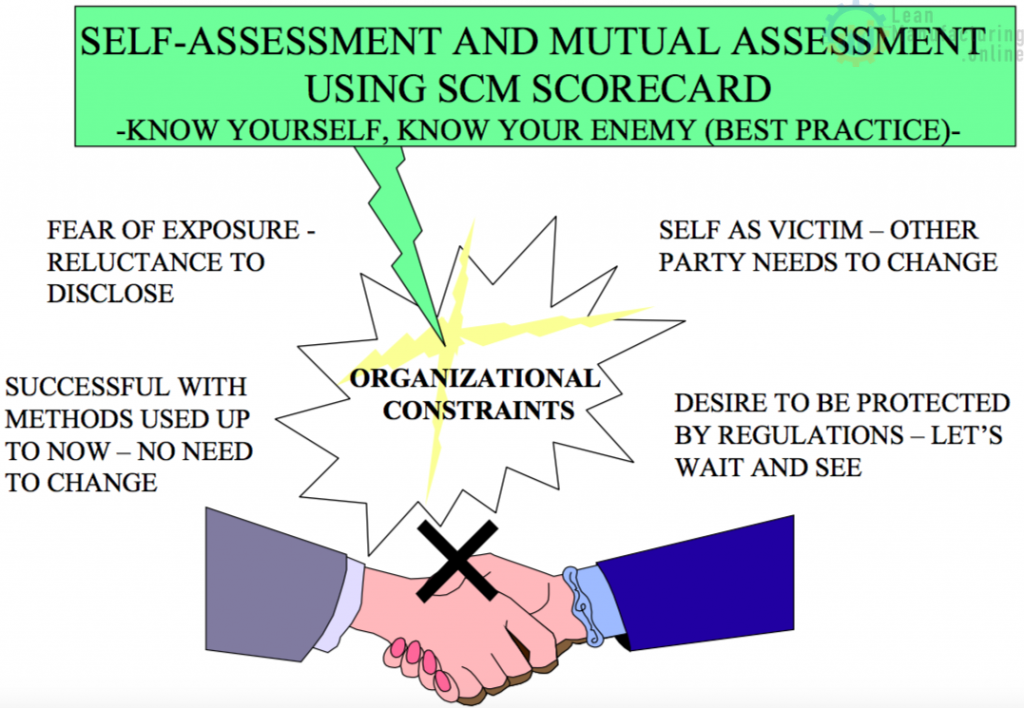
ACTUAL SITUATION AND ISSUES REGARDING INTERCOMPANY SCM (ORGANIZATIONAL CONSTRAINTS): SCORECARD
- Difficulty in making things more visible because of practical organizational constraints
- SCM logistics scorecard as a first step to breaking the deadlock
- Case study
ISSUES (ORGANIZATIONAL CONSTRAINTS)
- REFORMING INTERNAL WORKING PRACTICES
- Being swamped by what should really be routine work (lack of standardization or simplification: simple is best)
- INTER-COMPANY WIN-WIN PARTNERSHIPS: Agreeing in general but disagreeing with the particulars
- Inability to escape from past commercial practices and relationships (each party feeling victimized by the other; rebates and returns systems; retail outlet transfer pricing, etc.)
- Clinging on to systems that reward partial optimization
- Lack of fair criteria for apportioning cost and benefits
- (SOCIAL INFRASTRUCTURE) Standardization as an infrastructure for the utilization of it (characteristics of synergy assets + lowering of costs)
- Deadlock preventing the achievement of critical mass
- 80% common practice (adoption of standards) and 20% best practice (differentiation)
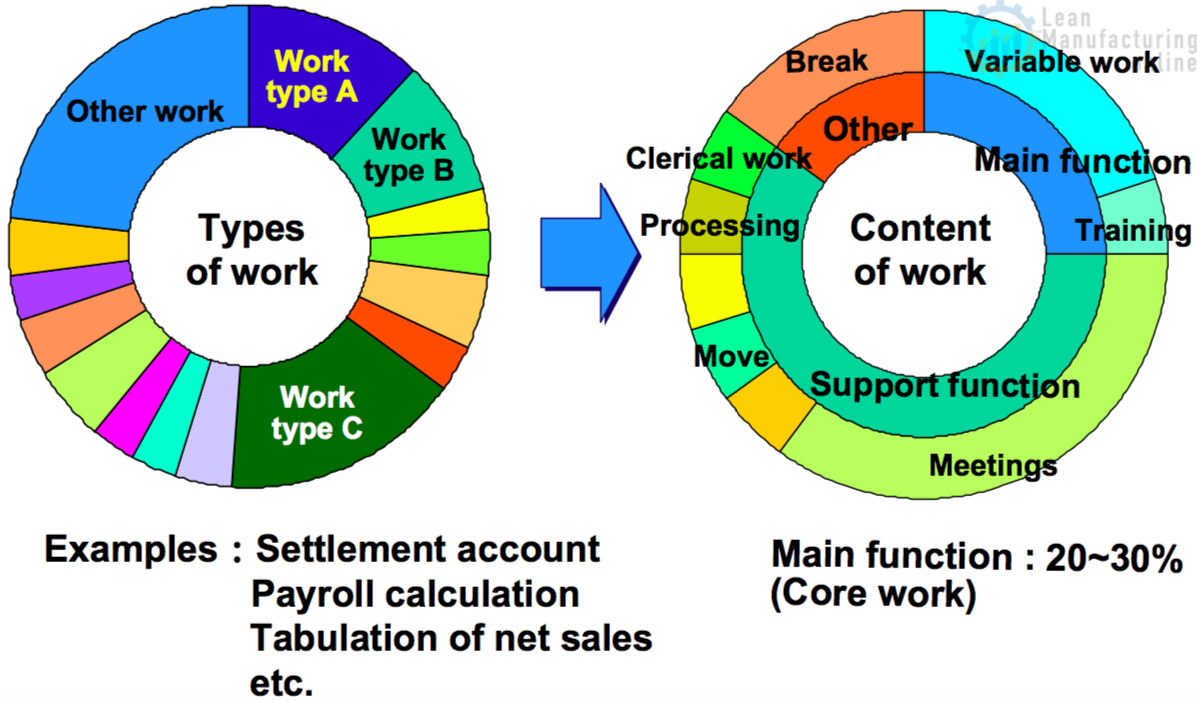
UNDER 20% OF BASIC TASKS STANDARDIZED
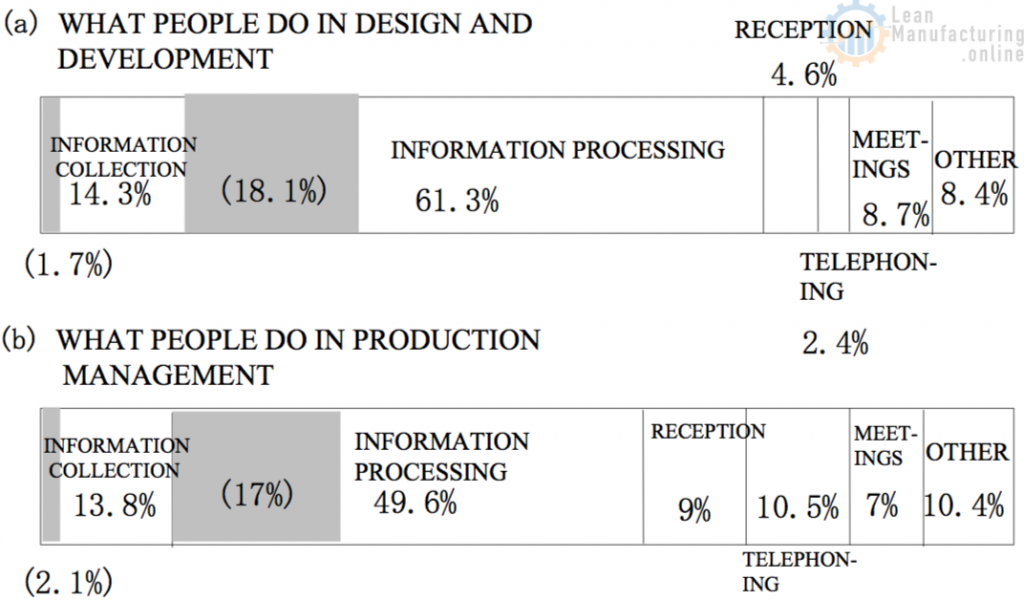
RESULTS OF A SURVEY OF WHAT PEOPLE ENGAGED IN DESIGN AND DEVELOPMENT AND PRODUCTION MANAGEMENT ACTUALLY DO (the shaded portions in the diagram indicate standardized basic tasks)
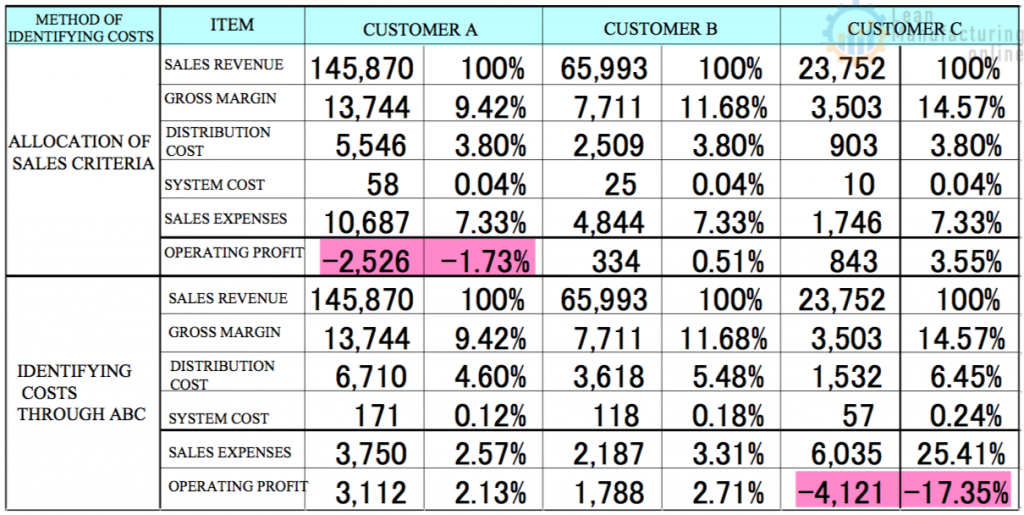
EXAMPLE OF IDENTIFYING INTERFACE COSTS THROUGH ACTIVITY-BASED COSTING (ABC)
THE SCM SCORECARD – A SIMPLE EXTERNAL ENEMY THAT CAN BREAK THROUGH ORGANIZATIONAL CONSTRAINTS
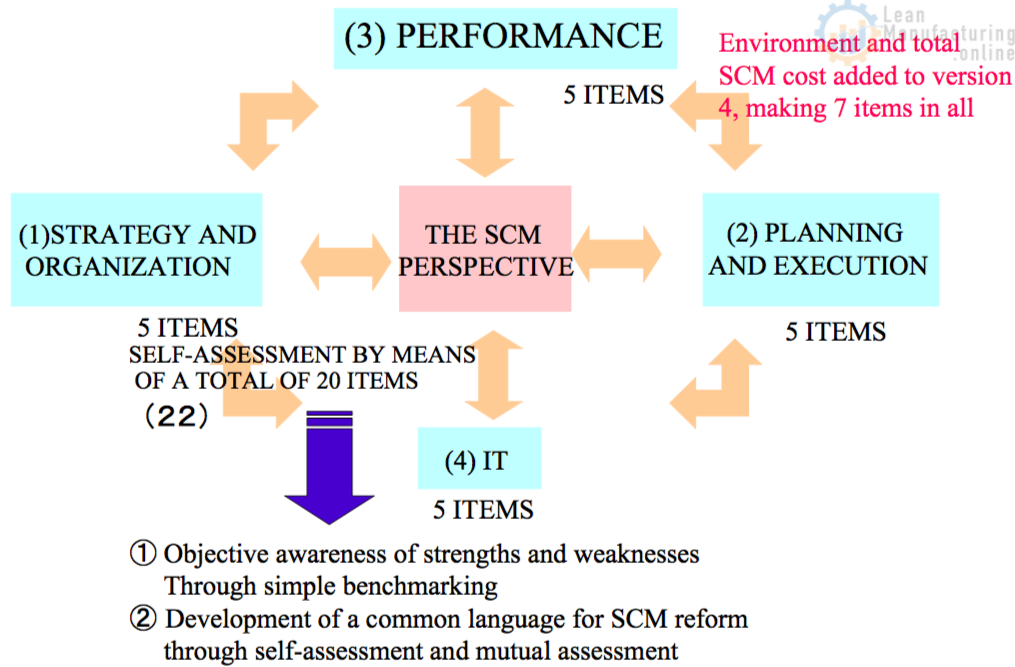
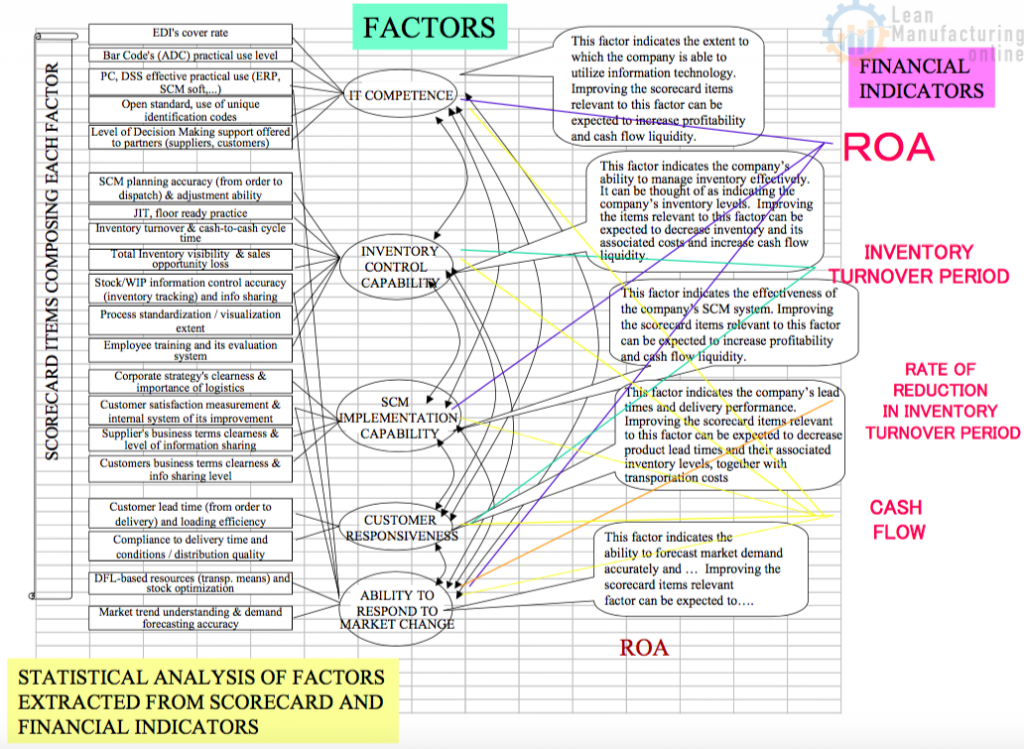
STRUCTURE AND AIMS OF THE SCM/3PL LOGISTICS SCORECARD
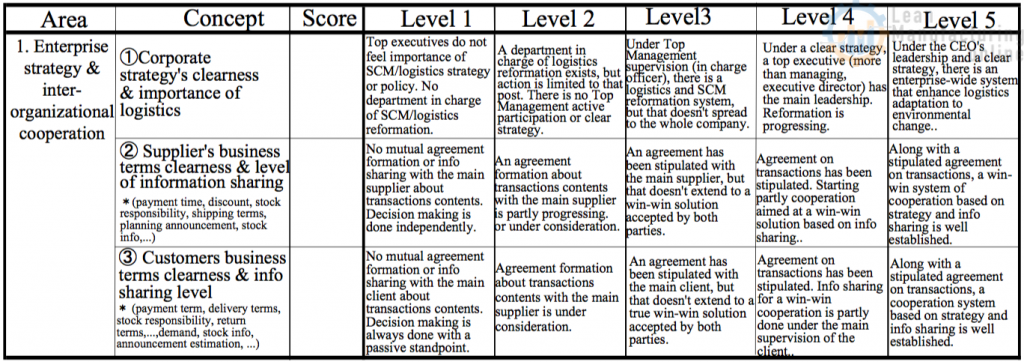
SCM/3PL SCORECARD (PART) AND DIAGNOSIS SYSTEM
DATABASE-BASED ASSESSMENT AND DIAGNOSTIC TOOL
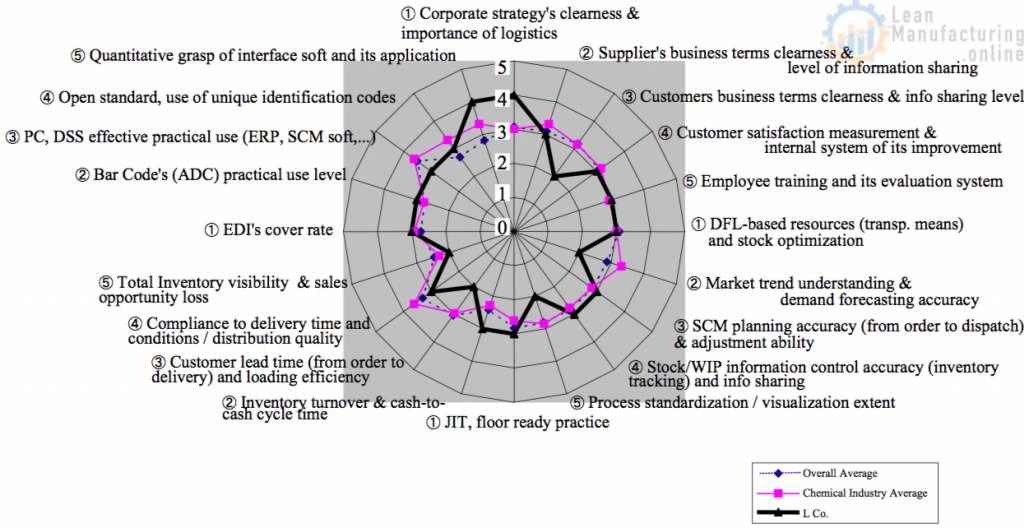
- OVERALL: Industry position and radar chart (awareness of strengths and weaknesses through comparison with industry average)
- FACTORS (Ability to respond to market change, customer responsiveness, SCM implementation capability, inventory control capability, IT competence,) are scored separately and the company’s industry position is displayed
- Diagnosis of a company’s overall strengths and weaknesses (recommendations)
STATISTICAL ANALYSIS OF FACTORS EXTRACTED FROM SCORECARD AND FINANCIAL INDICATORS
L Co. CASE STUDY
VALUES FOR EACH ITEM ON SCORECARD
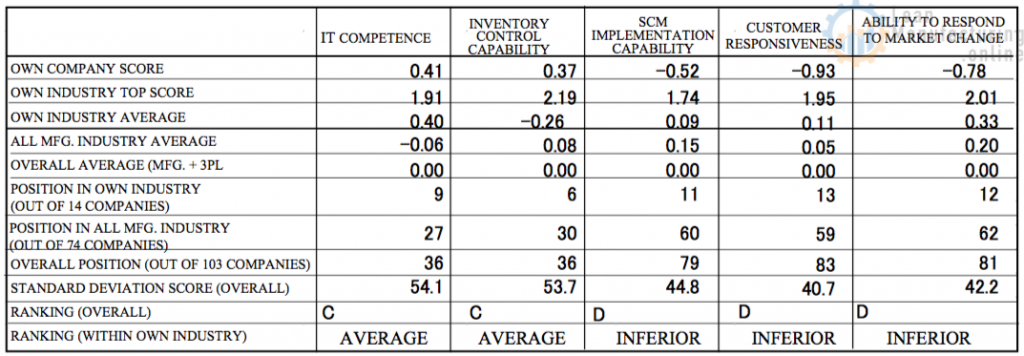
SCM IMPLEMENTATION CAPABILITY
Your company is ranked D (the bottom 7-30% of the overall population) in this indicator, which relates to profitability and cash flow liquidity. To improve this, your company needs to set out a clear logistics strategy, clarify and strengthen its relationships with customers and suppliers, and improve transaction terms, etc. In connection with this factor, your company should focus principally on Item 1-(3) (clarity of business terms and level of information-sharing with customers). In this item, your company should improve its working practices to reach the point where ‘clearly-documented agreements have been entered into with the most important customers, although true win-win situations benefiting both parties have not yet been achieved’.
CUSTOMER RESPONSIVENESS
Your company is ranked D (the bottom 7-30% of the overall population) in this indicator, which relates to ROA, inventory turnover rate, and cash flow liquidity. To strengthen this, your company needs to reduce lead times to the customer, increase the delivery compliance rate, and improve distribution quality. In connection with this factor, your company should focus principally on Item 3-(3) (customer lead time from order to delivery, and loading efficiency). In this item, your company should improve its working practices to reach the point where ‘customer-by-customer and item-by-item lead times are identified and monitored and are coordinated with a vehicle despatch schedule that maximizes loading efficiency’.
ABILITY TO RESPOND TO MARKET CHANGE
Your company is ranked D (the bottom 7-30% of the overall population) in this indicator, which relates to ROA and year-on-year inventory reduction. To strengthen this, your company needs to improve the accuracy of its demand forecasting and identification of market trends and review the location of distribution facilities from the overall logistics perspective. In this item, your company should improve its working practices to reach the point where ‘demand for the principal products is forecast based on the analysis of market trends and past data, involving sales and related functions’.
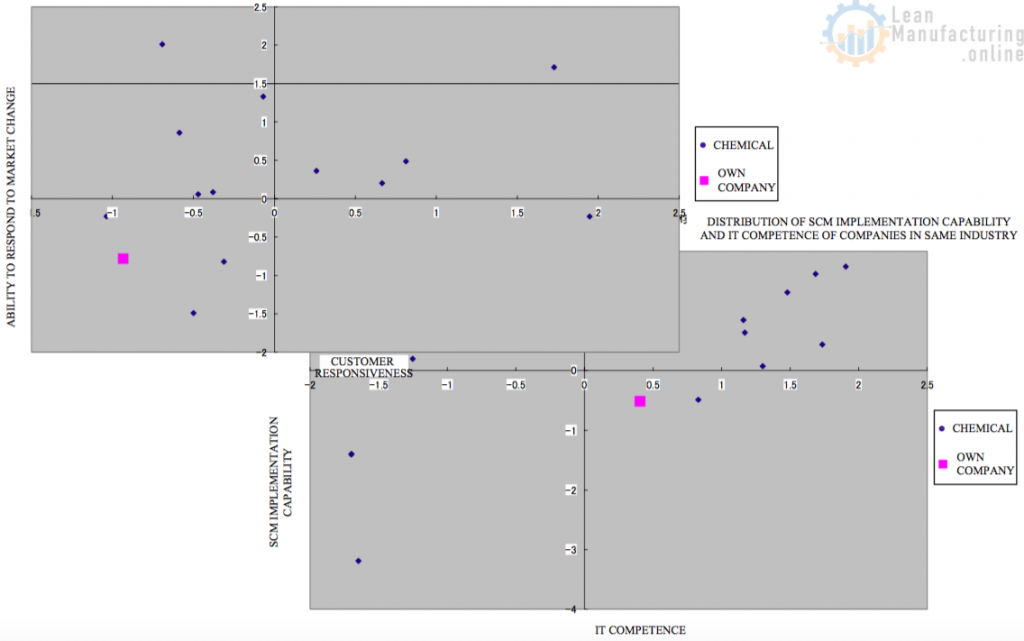
Distribution of ability to respond to market change and customer responsiveness of companies in the same industry
SECTION 5
EXPLOITING HIDDEN IT POTENTIAL
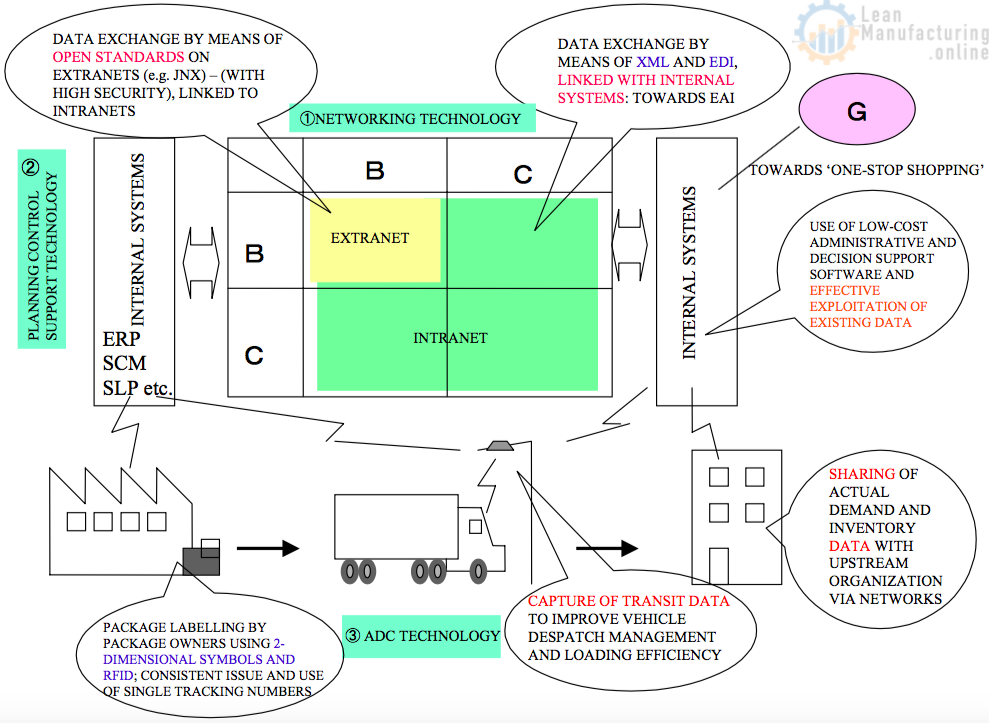
- THE IT REVOLUTION HAS STILL NOT HAPPENED! ・INFORMATION-SHARING × ADC TECHNOLOGY ×DECISION SUPPORT TECHNOLOGY
- 80% COMMON PRACTICE AND 20% BEST PRACTICE (THE TOUCHDOWN POINT FOR THE COOPERATION/COMPETITION DILEMMA)
- TOWARDS SCM THAT UTILIZES TPM’s STRENGTHS
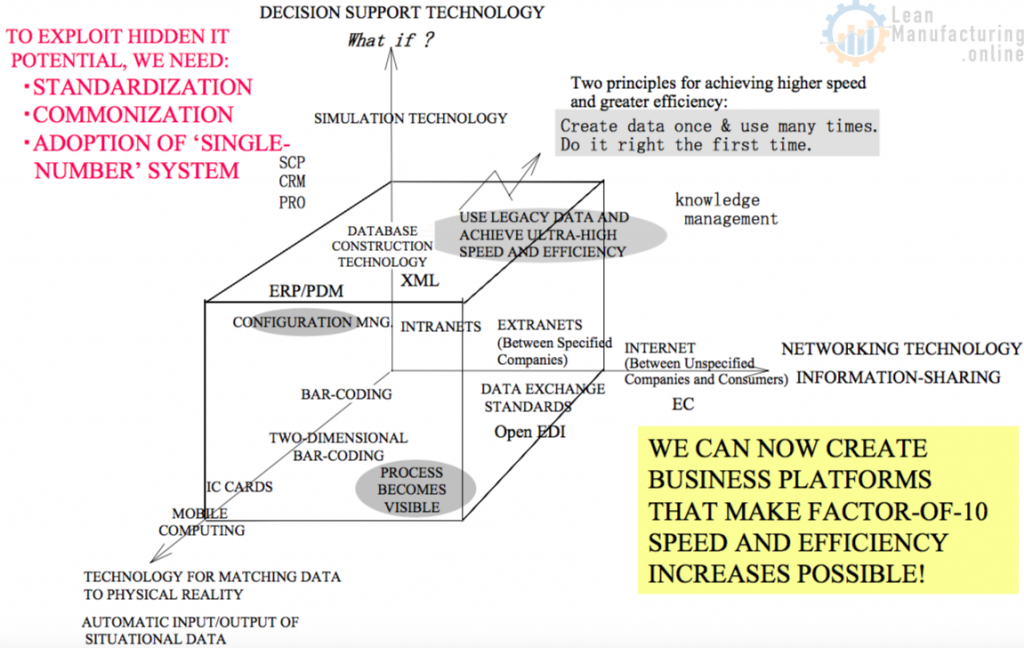
TYPES OF IT AS SEEN FROM THE PERSPECTIVE OF VALUE CREATION AND IMPROVING BUSINESS SPEED AND EFFICIENCY KEYWORDS: STANDARDIZATION AND DIFFERENTIATION-
- Networking Technology for Information-sharing – Internet/extranet/intranet and Application Standardization + Security Technology: Flow of Information (Flow of Business and Flow of Money)
- ADC Technology (Matching Data To Physical Reality) For Automatic, Real-time Input/output Of Situational Data Indispensable For Today’s Era Of Change: Flow of Goods
- Decision Support By Simulation Technology (e.g. SCM Products, CRM, PRO) More Efficient Control Of Data Structure Modification (ERP): Value Creation (Profit Maximization)
THREE APPROACHES AND FOCUS POINTS FOR IMPROVING LOGISTICS EFFICIENCY
80% COMMON PRACTICE AND 20% BEST PRACTICE
THE 3 PILLARS SUPPORTING COMPETITIVE ADVANTAGE IN MANUFACTURING


4M Analysis Process: Root Cause Guide for Manufacturing
Learn how to use 4M Analysis to find manufacturing root causes across People, Machine, Method, and Material with diagrams, examples, and checklist.


Hello, I’m looking for Demand Driven Planner Course, do you offer training materials? If not, can you please recommend online training course.
Thanks for your interest in our product. We have sent you some information, please check your email.
Hello
I am beginning the implementation of TPM in 2019 and I am looking for TPM training material . DO you offer some materials.
Thanks for your interest in our website. If you require any help with TPM implementation, please let us know and we will be happy to assist.
This would be of great benefit to us.
How do I go about engaging you to provide assistance in the implementation of TPM?
Please share your mail address and I shall communicate by mail.
Trevor,
Please check your email.
Worth reading! TPM or OEE processes are worth spending time. But the major part I would believe will be tracking of manufacturing losses in an effective way. The best the analysis the better the process. Being a PMP in automation I analyze these through Thrive’s Downtime Tracking Software. Please also share your views. Thanks!!