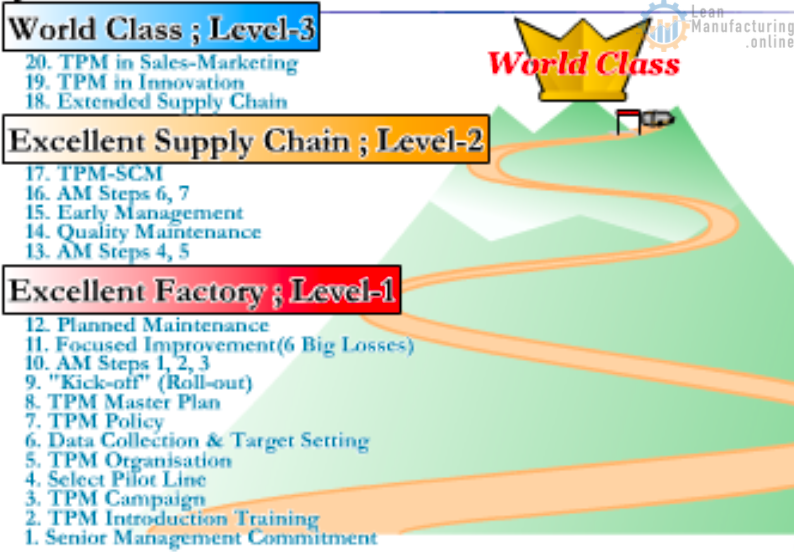
Master Plan
- Show the results for the main objectives with consistent benchmarks and targets – Breakdowns, Minor Stops, Quality Defects and ZERO loss time accidents.
- Highlight why the Site needs TPM. “TPM is not the objective; it is the way to deliver the objectives.”
- Each pillar must have key indicators to link to AM Pillar – highlight them.
- Understand the 5S process, develop the plan and implement it on the shop floor (do not advance until the individual S has been completed and audited).
Cluster Leader’s Recommendations – Autonomous Maintenance
Show how the key actions were implemented.
Focused Improvement – Accounting Department
- You still have an x.x% material loss. How are you identifying priorities?
- FI Kaizens – What is the impact on targets? Show how many were planned and executed.
AM – Production Manager
- Highlight the number of improvements.
- For AM Step 2, classify SoCs in ABC and prioritize actions.
- The prioritization has to follow:
- First, Spillage
- Second, Breakdown
- Third, no contamination on the shop floor
- Always show the SoC maps and the number of points.
- Understand the cost-effectiveness when eliminating “C” SoCs.
- For Level 1 Award, Final Audit:
- All packaging lines in Step 3
- Pilot line completing Step 4 – last module
- Conduct Step 4 by elements (pneumatics, electricity, sealants etc.)
- Two indicators for SoC – Forced Deterioration and Spillage
EM – Site Director
- How many breakdown analyses do you have?
- Implement recurrence matrix and improve quality
- Planned maintenance (as per Line xx query) – How often have PM activities been updated?
TLE – HR Manager
- Show the action training plan and progression
- Highlight completion percentage
- Explain how the training group prepares to eliminate breakdowns due to forced deterioration.
- Material to prevent Forced Deterioration –transfer of knowledge from mechanics to operators.
- AM Step 3 – 100% line operators to apply root cause analysis for breakdowns (specifically for forced deterioration)
- The TLE pillar is responsible for designing the process around training (e.g. Skill Matrix, annual training plan), monitoring the plan compliance, and ensuring the training methods.
QM – Quality Manager
- Analyze 100% of DMRs
- The QM Matrix should be implemented in the most advanced areas for the Level 1 Award based on the additional tools implemented to sustain the process (step 3 CIL, PM activities, minute amounts of SoCs).
SHE – Director of H&S
- Behaviour-based safety – variation in process to transfer to DuPont.
- How do you link behaviour-based safety and SHE Tags?
- Implement a process to build ZERO loss time accidents.
EIM – Engineering Manager
- Determine a process to classify projects in ABC
- Classify all tasks in ABC
- Do we have a vertical start-up? Demonstrate vertical start-up
- What part of the design process are you using? Use actual case studies.
MS – Logistics Manager
- Visualize current opportunities and implement case studies.
- How much do you expect to reduce in the Run size? Define a clear KPI and keep tracking.
EIM Process and MP Database – Engineering Manager, Director of Engineering
- Establish a clear flow with the DRs’ steps.
- Classify projects in ABC.
- For A priority projects – follow the entire flow. For B and C projects, skip portions of the flow.
- Always follow the EIM process and Ideal Funnel.
- Prepare a showcase, a good example – organize a vertical case study.
- Define aggressive targets for projects. E.g., eliminate 99% of dropping cases for new robots.
- Implement brainstorm sessions to understand and mitigate losses in the projects.
- In the showcase, highlight all resources used in the projects.
- MPs need more details for material thickness, specs etc.
- Identify sources for MPs generation.
- Ensure that all MPs are entered in 5 has 3 MP sheets not present in the database.
OEE Loss Tree – Production Manager
- I want to see the total number of minor stops: benchmark, evolution by year, monthly progression and target. Show stratification of minor holidays for the monthly advancement and use a separate graph for the stratification for the most recent month.
- How much was reduced in terms of minor stops and breakdowns over the years? Show clear information.
- For breakdowns, reduce 50% per year.
- For minor stops, reduce at least 50% from the benchmark.
FI – Material Loss Tree – Finance Manager
I want to see the material loss tree stratified by area, line, and machine. Restructure the information.
FI, Changeover – Maintenance/Production Hourly
- Explain ±15% variation in changeover times based on change.
- Why are some operators taking a long time?
FI, Weighing Scale – Production Supervisor, Maintenance Mechanic
- Stratify and analyze the different phenomena for Eagle Scale.
- Use stratification to show results.
- Implement visual demarcation for inspections in the line.
FI, Palletizing Area – Maintenance Supervisor, Production Operators
- Excellent job, but I still have problems
- Identify the following phenomena and analyze them up to zero.
FI, Raw Material – Production Operator, Planner, Maintenance Supervisor, Maintenance Manager, Maintenance Mechanic
- Setup – specific limits (visual demarcation) for worn-out items (brush, scraper and plate).
- Stratification – divide amongst machine-related and process-related.
FI, Packaging Material – Area Leader, Production Worker
- Estimate % of packagine material left on the core that cannot be saved.
- Stratify theoretical % savings
FI, Processing Room – Plant Controller, Processing Supervisor, Production Coordinator, Production Hourly Worker
- Who came up with the design idea? The show design process of the cone (3 prototypes)
- Remaining losses. What is left over?
SHE, Site’s Risk Assessment – H&S Manager
- How many routine tasks do you assess?
- What percentage of tasks has been implemented?
- Prioritize and implement continuous improvement activities.
SHE, Root Cause Analysis for Accidents – H&S Coordinator
- Show definition of accidents and incidents.
- Develop a more detailed analysis to identify the root cause.
- Identify key learnings from all analyses.
SHE, Recycling Program – Environmental Strategist
Can you stratify the data better, showing those points that can be eliminated? E.g. Food waste can be reduced.
SHE, Do & Don’t OPLs – H&S Manager
- SHE should react in a proactive manner.
- For some problems, e.g., spillage, we should not only show the prob situation the OPL but analyze the cause of y the problem exists also analyze the cause of y the problem.
MS, OR Loss Tree – Materials Supervisor
- How did MS support the plants’ progress?
- Can you separate the OR by area? Show the areas accountable for that problem.
MS, Inventory Program and Overage and Obsolescence Material – Procurement Coordinator
Use the methodological approach to conduce continuous improvement in the MS projects.
MS, Cycle Counting – SAP Specialist
Which are the opportunities you have? Identify the main reasons for inaccuracy and perform 5a Why analysis.
5S, Warehouse – Warehouse Supervisor, Shipping Coordinator
- I would love to see a list of the unnecessary items in the Red Tag area and analyze why you are throwing them out.
- I want to see a specific plan for the r implementation of 5S in your area.
- Divide the warehouse into sections and prioritize essential areas based on the n impact of business – allergens and high density.
- Do not jump steps. First S is necessary vs unnecessary items.
- Highlight activities.
AM, Line X – Production Operator, Maintenance Mechanic (Godfather of the line)
- Draw a precise map, prioritize ABC and highlight t number of SoCs, HTA
- Follow the process for SoCs: map number of points, describe the SoCs, use ECRS and for the complex issues, use 5Why analysis. Highlight percentage completed.
- Try to understand the mechanism of the SoC deeply
- Apply ECRS for each mechanism
- Line 7 is not a pilot line – it is the faster line.
- Require monthly graphs for all daily KPIs.
- For the monthly basis, need a benchmark, previous years, monthly progression and target.
AM, Line 5 – Production Operators, Area Leader, Production Coordinator
- Require monthly graphs for all daily KPIs.
- For the monthly basis, need d benchmark, previous years, monthly progression and target.
- Use tab to divide – daily, monthly.
- Show number and completion of SoCs and HTAs.
- Present the pilot Step 2 process to facilitators upon completion.
- For Step 3, define clear criteria and standards for each inspection point.
- We still have a spillage on the floor – analyze the mechanism.
- Step 2, no contamination on the floor or from critical items
AM, Line Xx – Maintenance Mechanic, Area Leader, Production Operators
- More detailed ECRS
- How do you evaluate the effectiveness of each countermeasure? Try to understand countermeasure the effect of countermeasure and spillage.
- Stratify the KPI better to understand the fact of countermeasure.
- Same as Line Xx
AM, Palletizing – Production Operators, Maintenance Supervisor
- Implement and-drawn hand-drawn graphs
- For the monthly basis, need a benchmark, previous years, monthly progression and target.
- Measure after cleaning if there is a decrease in breakdowns/minor stops.
- Choose critical areas (by breakdown) to do a deep cleaning and inspections. Highlight the findings in that area through OPLs, F-Tags and breakdown reductions.
AM, Processing Room 5S and AM Step 1 – Processing Lead Hand
Ensure to finish 1 S before proceeding to the next after the audit.
QA and QM Discussion – Quality Director
- Technically, we should implement QM Matrix (QM 10 Steps) in the most advanced areas.
- In AM Step 3, you need to get less than 1% of quality defects.
- FI for quality has to be used since Step 0.
QM, DMR Analysis – QA Manager
Stratify and show progress for different phenomena.
QM, Allergen Program – Quality Supervisor
Who did the Changeover Matrix? Positive feedback!
QM, Consumer Complaints – Senior Quality Coordinator, Quality Manager
Tools for the Root Cause – FMEA. Receive training from Process Excellence.
(Understand and prioritize tools to eliminate quality defects.)
TLE, HR Manager
- Implement and show how you are controlling the training program in the factory.
- How many trainings were delivered?
- How many people received the training?
- How do you measure the quality?
- % compliance against the plan.
- The skill matrix is fundamental. Suggestion: Update according to the AM Steps advancement.
EM, Kaizen Flipping boxes Case Stacker – Maintenance Supervisor, Maintenance Mechanic
Time chart for boxes pop-up (understand and show the positions of the boxes during the movement of the conveyor).
EM, Kaizen Cartoner Jams Line XX – Maintenance Supervisor, Mechanic
- Analyze problems for different phenomena.
- Why are there no ZERO breakdowns?
EM, Kaizen Case Sorting – Mixing Boxes – Maintenance Supervisor, Palletizing Operator
- Good Analysis, but we still have problems
- Identify the phenomena remaining and analyze them up to ZERO.
EM, Kaizen De-stacker Jams Line Xx – Maintenance Supervisor
- What is the maximum and minimum distance between the 2 cases? Understand how space distance affects the time to index the case.
- Why are there no ZERO breakdowns?
EM, Cap-Do Air blast Valves Ln XX-xx – Maintenance Mechanic
- Who came up with the idea? Excellent idea!
- Keep Treasures
EM, Cap-Do Foil Splicer – Area Leader
- How often do you check the diaphragm and clutch brake?
- How often do you update your PM plan?
- Why are there no ZERO breakdowns?
EM, Parts Store KPIs – Stores Clerk
- Target 99% accuracy in parts store for the end of 20XX.
- How are we categorizing parts?
- Establish clear actions to improve KPIs.
- Define a plan to implement 5S.
- Breakdowns low- adjust parts accordingly.
- Why are slow movers so high? Understand and establish an action plan.
Final TPM Auditor’s Feedback
- The factory should deliver Step 4 in the Pilot Line for April to challenge the Excellence Award year.
- TLE and EM have to be strongly linked with AM.
- Eliminate forced deterioration for breakdowns.
- Understand the mechanism of the problem to eliminate spillage.
- Understand and highlight the connections between SoC, forced deterioration, and the breakdown and how each impacts the other.
- AM Step 3:
- Operators analyze forced deterioration.
- ZERO caused deterioration breakdowns in the pilot line by December 20XX.
- Update CIL standards
- Step 3 Feedback loop
- Draw mechanism of SoC, e.g., flyaway raw material on Line Xx
EM
- No ZERO breakdown case study. Emphasize.
- Mechanics to apply simple 5Why. Share root cause with the line operators.
- Breakdown meetings with AM Teams in Step 3 – use to improve CIL STDs.
- Highlight the TBM process. When and how often is it updated?
FI
- Highlight BM and target for every KPI.
- The general process is good.
QM
- Establish DMR Loss Tree
- Analyze using simple 5 Whys product on hold – 100%
- Show the defects structure.
- End of Step 3, Line X QM Matrix
SHE
- Show Zero Accidents Environment.
- Show specific root cause.
- Reduce waste for recycling program through Kaizen study.
MS
- Show the opportunities you have continuous programs for the primary opportunity options. The next session demonstrates the case study and the improvement.
General Observations
- Avoid showing wish lists.
- Focus showing case studies with logical flow, clear actions and results.
