(1) Stabilize causal factors
A distinction should be drawn between causal factors and true causes. Causal factors are anything that might conceivably affect the problem phenomenon, while true causes are anything that has actually been proven to or deduced to produce it, either directly or indirectly. True causes are therefore a subset of causal factors. Causal factors may be variable, semi-fixed or fixed. Variable causal factors are by definition liable to change at any time. They are difficult to fix and, even if fixed, are unlikely to remain so for long; they include the changes resulting from product changeover, parts replacement, work by a different operator, and component deterioration, for example. Stabilizing a causal factor means fixing it so that it cannot change.
Semi-fixed and fixed factors are distinguished for convenience according to the length of time for which they remain constant. Semi-fixed factors are those that remain unchanged for a period of at least 6 months to 2 years provided that the equipment has been properly restored and all the parts that need to be replaced have been replaced (as mentioned previously, if the static and dynamic precision of a machine and its associated fixtures are restored to their original level, they should stay at that level for a reasonably long time). Fixed factors are those which, provided they are properly restored, remain unchanged for a period of 5 to 6 years; for example, misalignment in the installation of a machine, insufficient dynamic rigidity, and so forth. Once corrected, factors like this tend to stay corrected for a long time.
When something goes wrong on a production floor, a great many factors could be implicated in the problem. Because these factors are not fixed, the work is being carried on amid great instability, with everything in flux. This is why it is so important to reduce the number of variables by stabilizing the causal factors one by one, making them fixed or at least semi-fixed. Some variables relate to people (e.g. problems due to poor cleaning, problems due to poor methods of disassembly and reassembly, problems due to poor changeover methods, or problems due to inadequate setting of processing conditions), while others relate to hardware (e.g. problems due to failure to maintain jig or machine precision).
Different people tend to perform the same job (operation, changeover, adjustment, etc.) in slightly different ways. People-related factors are often variable precisely because it is so difficult to ensure that everyone does everything in exactly the same way. In contrast, equipment-related factors are often variable because the precision of the equipment is not properly maintained. They can be turned into semi-fixed factors by restoring the equipment, because, once restored, it will stay that way for some time. Nevertheless, semi-fixed factors will eventually revert to being variable if left to themselves, and this is why it is necessary to establish some means of monitoring them to see whether they are changing or not.
In summary, the important thing is to examine each causal factor in turn, compare it with its ideal condition, and restore it in such a way that it remains fixed for as long as possible. The fewer variable factors acting in a situation, the easier it is to reduce the level of quality defects.
(2) Do comparative studies
When trying to reduce quality defects, it is important to compare the equipment or process where things are going wrong with other equipment or processes where things are not going wrong in order to try to identify any significant differences. Many simple quality problems remain unsolved because this is not done. Comparative studies are useful for determining (both quantitatively and qualitatively) where, how, to what extent and why the differences between acceptable and unacceptable products arise. There are three basic methods of carrying them out:
1 Compare the results (i.e. the products)
Compare how defective products differ from good ones in terms of their shape, size, functions, etc., and investigate how the defects vary over time and with their location on the product.
2 Compare the processes
Compare the shapes, sizes, surface roughness, etc. of machines, jigs, tools, dies and other equipment producing defective products with those producing good ones. When doing this, it is particularly important to develop methods of measuring apparently unquantifiable attributes.
3 Compare the effects of replacing parts
With an assembled product, the effects of interchanging product parts thought to be relevant to the defect should be investigated. Machine parts, jigs and tools should also be replaced to see what happens.
When making comparisons, factors such as the following should be examined:
Objects
- shape and size
Location - section of machine } What is normal in terms of shape and size?
Time - time period of occurrence changeover
Processing conditions
- characteristics of mechanical motions
- operating conditions themselves
Equipment - static and dynamic precision } What is normal? What are the conditions for producing good product?
Jigs and tools - static and dynamic precision
- surface roughness
When doing this, the following points should be noted:
- Increase analytical precision – devise ways of identifying even the slightest differences When things appear identical to the naked eye, it is important to look for slight variations by using a magnifying glass, a microscope, etc. The key is to highlight small differences that were not recognised in the past in order to identify the normal condition exactly. Using a higher level of analytical precision makes it possible to recognise significant differences. It is particularly important to analyse unquantifiable shape differences, since unquantifiable factors are often the biggest problem.
- Develop new methods of measurement It is often necessary to develop new measurement techniques in order to detect significant differences, such as degrees of surface roughness that do not show up in the dimensions, localised uneven wear, etc. Surface roughness gauges and microscopes with projectors can be particularly useful.
(3) Apply the “zero” approach (use P-M Analysis)
There are three principal reasons why product quality defects remain unsolved:
- Insufficient analysis of the phenomenon
- Inadequate grasp of causal factors
- Poor identification of deficiencies in the causal factors
1 The conventional approach to improvement
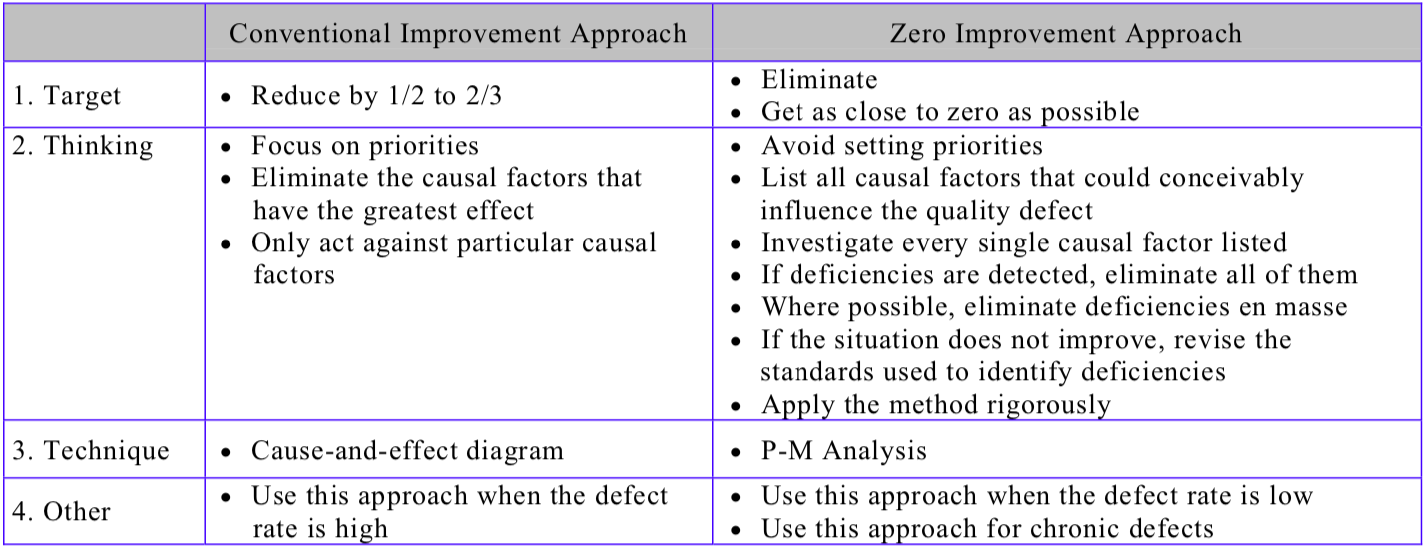
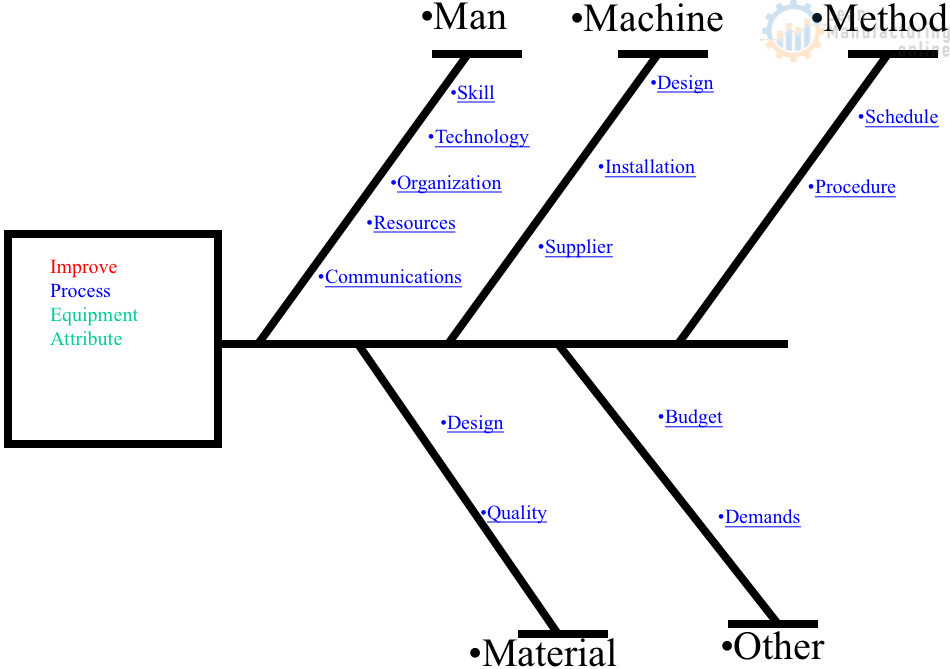
The QC story format (establish the reason for selecting a topic – set targets – analyze the current situation – analyze causal factors – take corrective action – check results – standardize – decide on future issues) is a widely-used improvement approach for reducing breakdowns and quality defects on the shop floor because it is so easy to apply. The cause-and-effect (fishbone/Ishikawa) diagram is also a commonly-used improvement tool when the target is to bring problems down to 1/2 – 1/3 of their current level.
The thinking behind these approaches, however, is priority-based; in other words, they are targeted at the biggest problems, the biggest defects, and the improvements that will bring the biggest results. When tackling quality defects, for example, the idea is to start by identifying the biggest defect, analyze its causes, and eliminate the causes that have the greatest effect on the problem.
While there is nothing inherently wrong with this approach, and it can be very successful in reducing defect rates by as much as 1/2 or 2/3, it very rarely succeeds in reducing them to zero. It is effective when the defect rate is at a high level of 5%-10%, but ineffective when the defect rate is at a low level of 1% or less.
2 The “zero” approach to improvement
The basic principle behind reducing chronic quality defects to zero is to avoid prioritizing. Acting only against the causal factors that have the biggest impact on the quality defect in question, or correcting only the larger deficiencies, is the wrong way to go about eliminating chronic quality defects once and for all. With many chronic quality defects, it is often impossible to determine how much each causal factor contributes to the defect, or which is the true cause. This is why the priority-based approach of focusing on a small number of what are thought to be the most important factors is ineffective. With chronic quality defects, it is necessary to act equally against all causal factors that could conceivably influence the problem, regardless of how great or small their influence might be. Any deficiencies must be identified, regardless of their size, and every single one must be corrected.
In short, the keys to eliminating chronic quality defects are:
(a) Review all causal factors
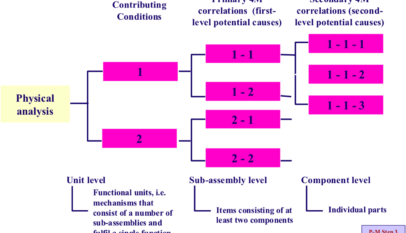
The fact that a quality defect is occurring means either that some of the causal factors that should be controlled have been overlooked, or that there are deficiencies in some of the causal factors that are being controlled. Solving the problem, therefore, requires a comprehensive review of all the causal factors. This requires the application of P-M Analysis, based on a sound understanding of the concept behind it.
(b) Investigate everything about each causal factor
Every single causal factor in the list generated by P-M Analysis or fishbone analysis should be investigated to determine whether or not it is deficient in any way. Although a comprehensive investigation like this may be difficult because of the time and resources required, it must be done.
There is an inevitable tendency if two or three deficiencies thought to be of great or moderate significance are detected during the course of the investigation, to focus on these and forget about the rest. This will not work at all. Naturally, it is important to take action against large or medium-sized deficiencies, because they have a commensurately large effect on the problem; but they are not the end of the story. There may also be deficiencies in other causal factors. It is of the utmost importance to investigate every single causal factor in order to find out whether or not it contains any deficiency because it is impossible to achieve zero quality defects if only the larger deficiencies are considered. Experience has shown that the defect rate may drop temporarily if this is done, but will soon revert to its original level.
(c) Correct every single deficiency
The following should be identified as deficiencies:
- A discrepancy between a parameter and the current official standard.
- A discrepancy between a parameter and a provisional technical standard, if no official standard exists.
- Failure of a component to function in the most desirable way, even if no official standard has been set.
- Borderline cases that might or might not be a deficiency.
In addition, the optimal state of assemblies and individual components should be identified (mainly from the functional standpoint) and any deviation from this should be treated as a deficiency.
When measurements are performed in order to identify deficiencies, there are often problems with the way the measurements are taken, the way reference surfaces are established, and so on. When searching for deficiencies, we should always ensure that the most appropriate measurement technique is used. When deficiencies have been identified, they should all be eliminated, regardless of how much they contribute to the quality defect. It is essential to go back to the basics and get everything into its best possible condition.
(d) Correct deficiencies en masse
The conventional approach once a number of deficiencies have been identified is to correct them one by one, checking the result each time. For example, if 10 deficiencies have been found, the effect on the result is checked a total of 10 separate times. Although this is method is not wrong per se, the causes of quality defects are often unclear, making it impossible to determine whether correcting a particular deficiency has been effective or not.
In the zero approaches to eliminating quality defects, we correct all the deficiencies together; if there are 10 deficiencies, for example, we correct all 10 at the same time. As discussed in the section on the characteristics of chronic quality defects, their causes fall into one of two patterns: multiple causes acting one at a time, or complex combinations of causes. When the influence of each individual deficiency on the quality defect is slight, the relationship between any particular corrective action and the result it produces is weak, so a difference is more likely to be seen in the result after all the deficiencies have been eliminated. Some people complain that this approach makes it difficult to ensure that the solution is sustained because it is impossible to know which corrective actions have produced the result. However, clear cause-and-effect relationships are usually very hard to determine in the case of chronic defects, and there is not a lot of point in trying to do so. If eliminating the deficiencies in the causal factors cures the quality defect, it is sufficient to take steps to keep the causal factors in their optimal state; this will ensure that the solution is sustained.
(e) If there is no improvement, repeat the exercise
Sometimes, the hoped-for result is not achieved even after a P-M Analysis or fishbone analysis has been conducted and all the deficiencies have been eliminated. There are several possible reasons for this, for example:
- Some causal factors have been overlooked.
- The identification of the deficiencies was inadequate (insufficiently rigorous, resulting in some deficiencies being missed).
- There are problems with the established standard values.
- There are problems with the measurement methods (unsuitable techniques, unsatisfactory selection of reference surfaces, etc.).
- There are problems with the way in which the deficiencies were eliminated.
Although it requires a lot of commitment to redo the analysis, it is important not to give up but to apply the approach exhaustively. Doing so will provide the opportunity to rectify the above problems and ultimately reach a satisfactory solution.
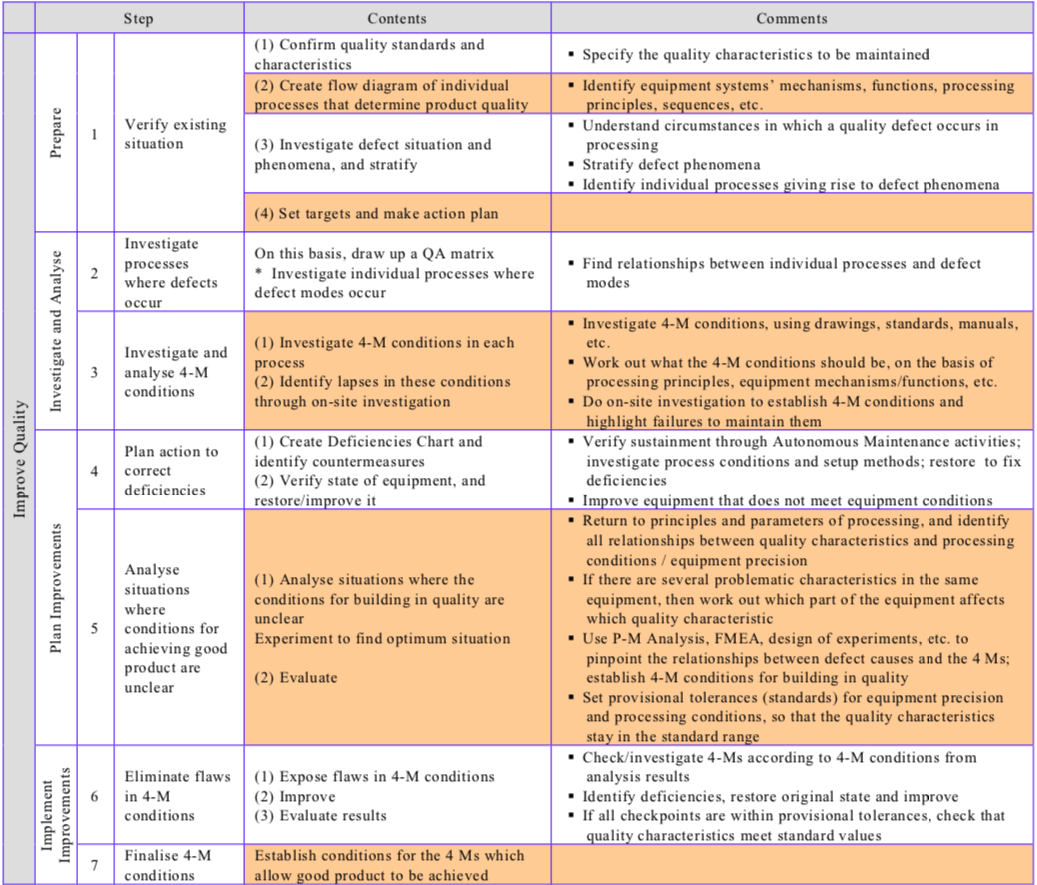
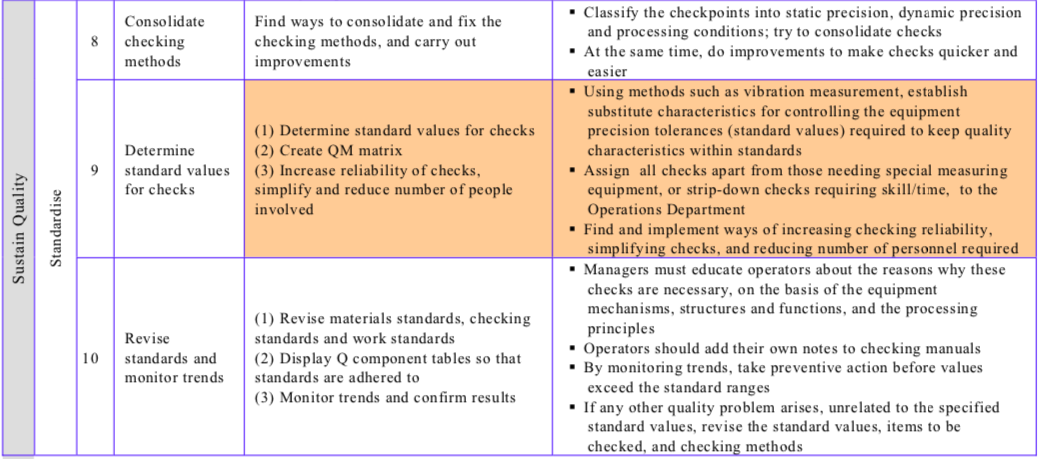
Table “The Conventional Improvement Approach and the Zero Approach Compared” contrasts the conventional and zero improvement approaches, while Table “Procedure for Reducing Quality Defects” shows the steps involved in reducing quality defects/establishing quality maintenance.
