This section describes what must be done to develop Quality Maintenance in processes where quality is built into the product by manual work instead of processes where machines are the primary determinant of product quality. This approach uses the Process Quality Assurance Rate Evaluation Tables rather than the QM Matrix. It also uses the Figure-of- Eight Method from the start, without first applying the 10-Step Procedure.
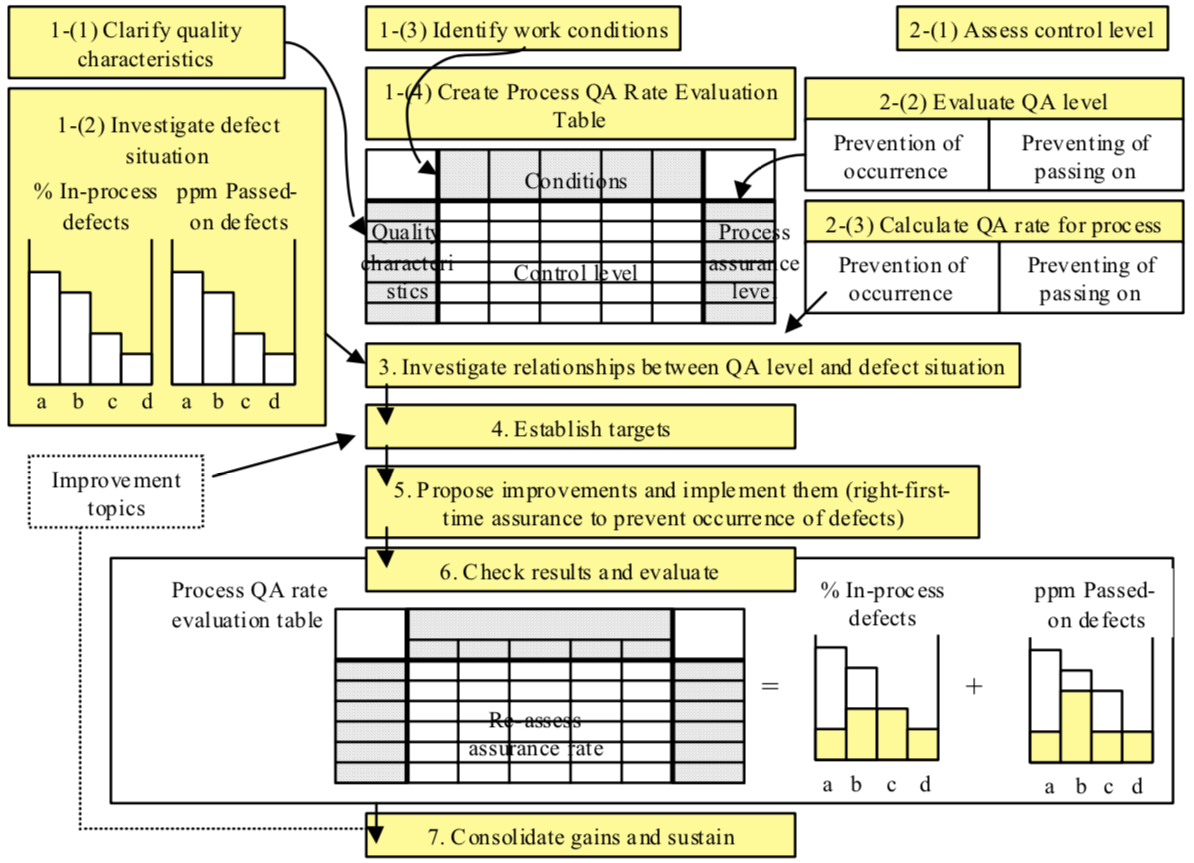
Step 1 Identify Existing Situation (Clarify Quality Characteristics and Work Conditions)
In this step, we identify the quality characteristics to be built into the product during the process, along with the work conditions that must be fulfilled to achieve this quality. This gives us the framework of the Process Quality Assurance Rate Evaluation Table and puts us in a position to assess the assurance rate. It involves the following sub-steps:
(1) Clarify the quality characteristics
(2) Investigate the situation of in-process defects and passed-on defects
(3) Identify the work conditions for each process
(4) Create a Process QA Rate Evaluation Table
Step 2 Restore (Assess Control Level and QA Level, and Calculate Process QA Rate)
Here, we assess the control level for each work condition and find the current QA rate for the process. This involves:
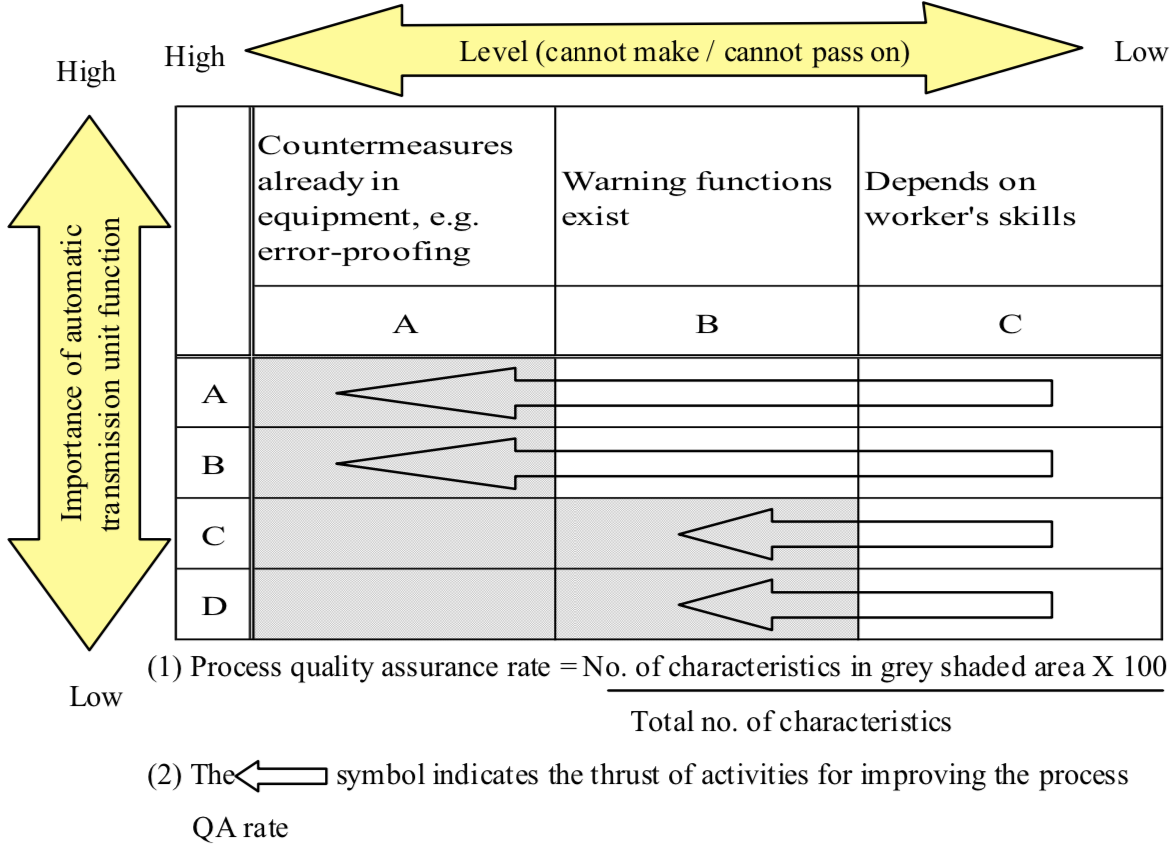
(1) Evaluating the control level for each work condition (see Table “Standards for Evaluating Level of Control of Rules and Procedures”)
(2) Evaluating the QA level for each quality characteristic
(3) Calculating the QA rate for the process

Step 3 Analyze Causes (Investigate Relationship between QA Level and Defects (In-Process Defects and Passed-On Defects)
This requires us to look for cause-effect relationships between the defect situations examined in Step 1 and the QA levels identified in Step 2. If we can find what causes lead to what effects, we can move on to the next step and improve the QA level. But if these relationships are not transparent, then we must go back and re-evaluate the control levels for each work condition.
Step 4 Eradicate Causes (Establish Improvement Targets)
Improvement topics are listed in order of importance, starting from the control levels that currently show the most significant degree of error. From experience, the target QA rate should be set to 80% or above.
Step 5 Establish Conditions (Propose Improvements and Implement)
When proposing improvements, we must start by searching for ideas at control level A rather than just being content to find easy solutions at level B. Although it may be possible to reach level A by applying different ideas, we must first try to find one-shot solutions.
(1) Think of ways to prevent defects occurring before ways to prevent passing them on.
(2) Think of single solutions to assure quality before applying combinations of solutions.
Step 6 Improve Conditions (Check Results and Evaluate)
Check the results to ensure that the improved control levels translate into fewer defects.
Step 7 Maintain Conditions (Consolidate Gains and Sustain)
If the results are favourable, we must find ways of locking down the situation so that the improved work conditions are maintained, and we must sustain these improvements consistently.
Figure “Procedure for Developing Quality Maintenance in Manual Work Processes” gives an outline of how Quality Maintenance can be developed through the use of Process Quality Assurance Rate Evaluation Tables.
Case Study
This case study looks at how QM can be developed in an assembly process, and it comes from a company that makes automatic transmission systems for cars. Figure “Quality Assurance Rate in an Assembly Process” shows how the company defined the quality assurance rate in its assembly process.
Step 1 Identify Existing Situation
(1) Investigate defect situation
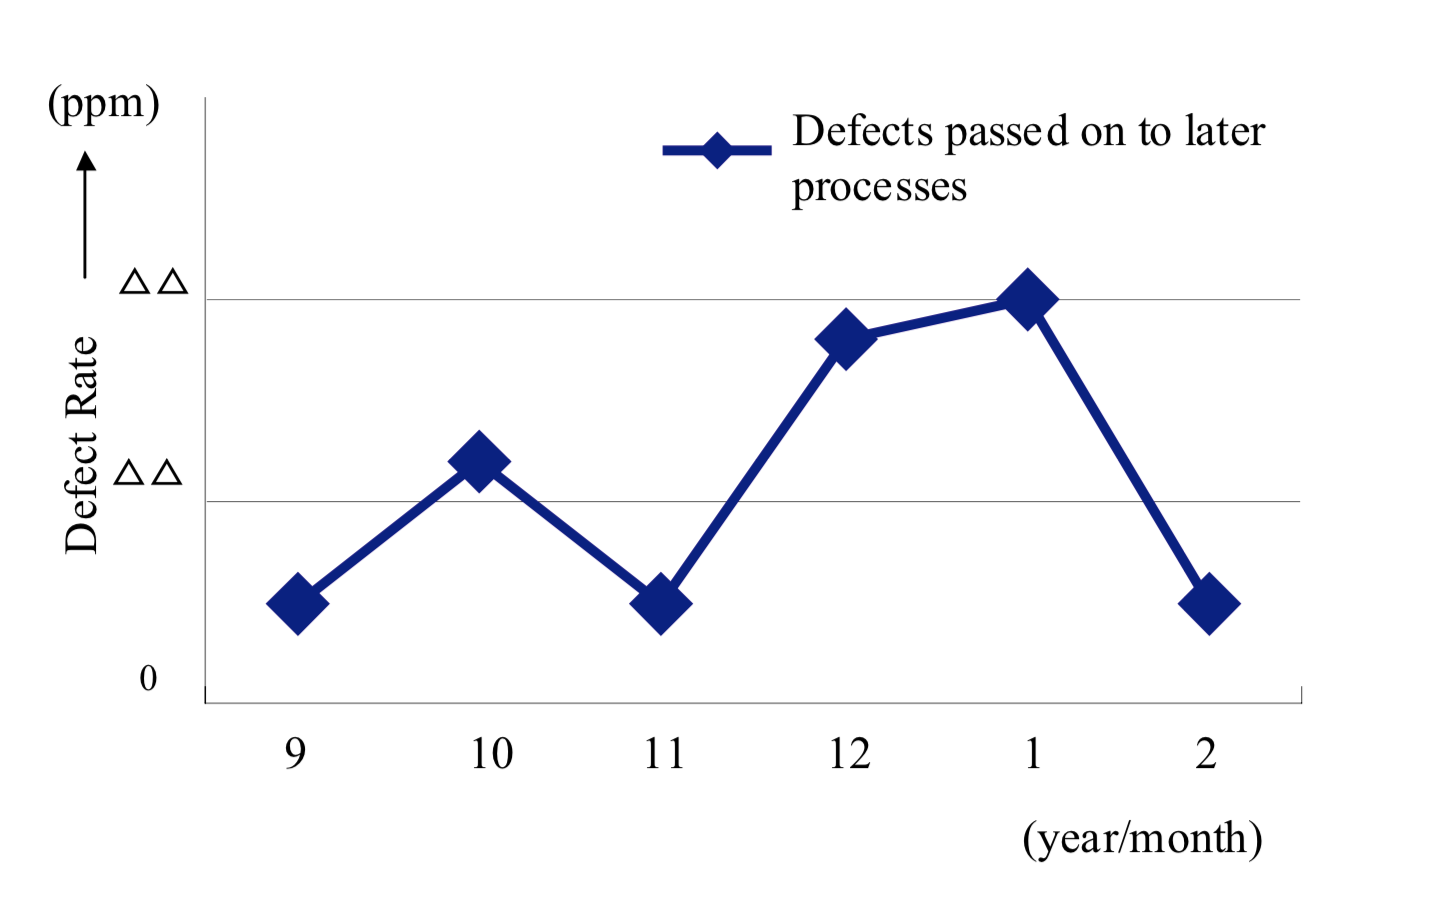
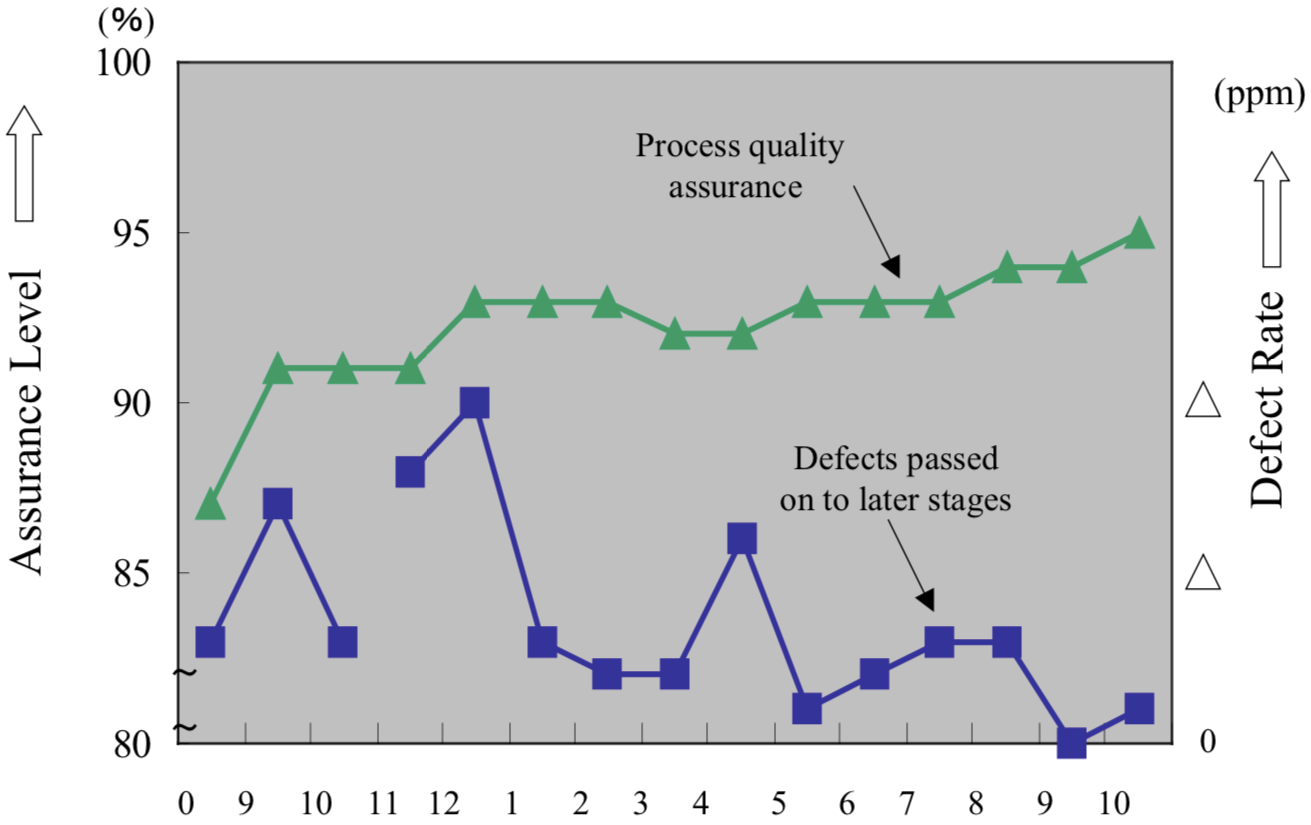
Figure “Trend in Rate of Assembly Defects” relates to one of the assembly lines for front-engine front-wheel-drive transmissions and shows the level of defects created in that line and carried over to subsequent processes. The company relied on pre-shipment performance inspections to prevent these defects from being passed on to the end customer.
The firm, therefore, instigated a company-wide QA accreditation scheme to reward excellence in the field of quality. They aimed to build quality into the product through their processes, and the initiative was very successful. Here, we look in detail at how this was applied to the assembly line and its results.
(2) Create Process Quality Assurance Rate Evaluation Table
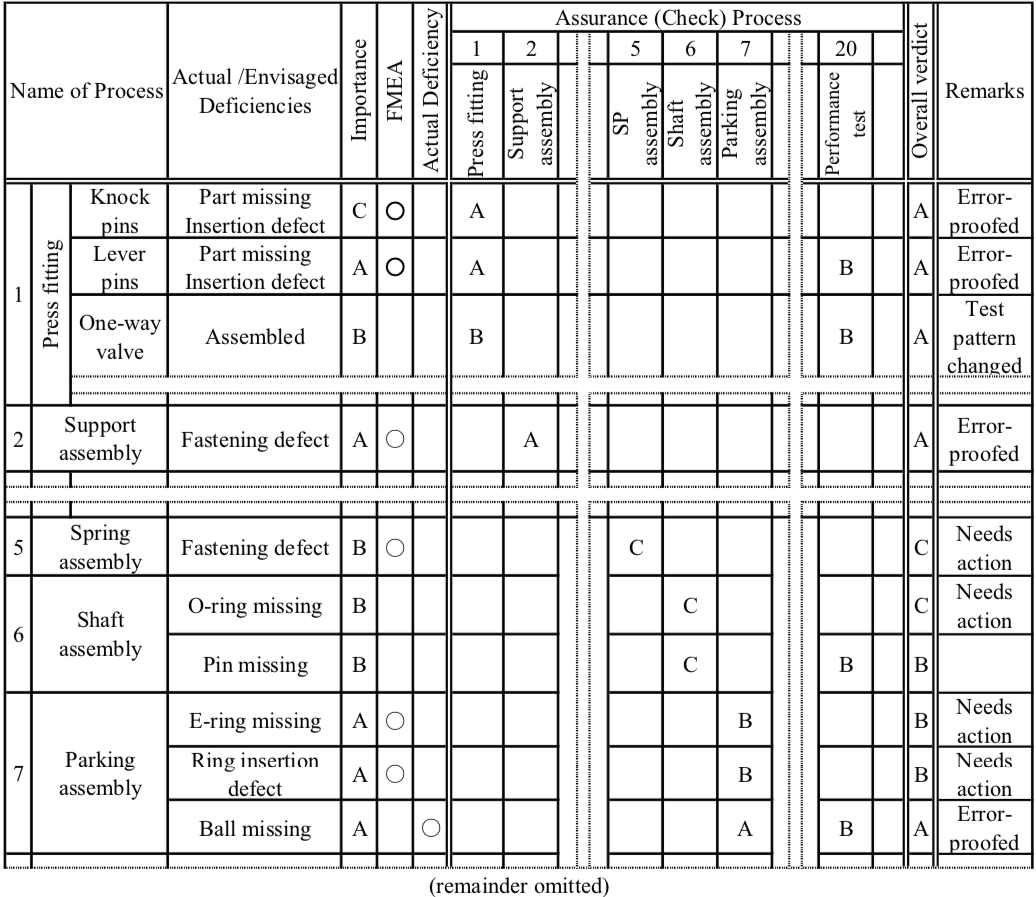
To develop its program for recognizing and rewarding excellence, the company drew up an evaluation table based on forecasting the occurrence of defects and assessing the QA rate of the assembly process. Firstly, each assembly operation was listed, with the actual and predicted deficiencies for that process. The quality assurance (checking) procedures were used (see Table “QA Matrix (Process QA Rate Evaluation Table)” in the next lesson).
Step 2 Restore
(1) Evaluate QA levels for each process and calculate process QA rate
The company took the Process Quality Assurance Rate Evaluation Table, or ‘QA Matrix,’ as they called it, and noted down what checks were used and what level of assurance was established for each of the deficiencies (QA items). They then made an overall judgment about each item and what assurance rate it had achieved (see Table 8.10). This process of investigation revealed a process QA rate of 87.2%.
(2) Ensure the rules are followed and assess the results
The QA figure of 87.2% included points that were not being implemented fully, and the company decided to re-educate the workers about the ideal conditions so that they would take them on board. Although this reduced quality fluctuations, the QA level was still low in many cases, so the company embarked on an improvement cycle while sustaining the current situation.
Step 3 Analyze Causes
(1) Investigate current work
The company undertook a detailed investigation of the work procedures and methods currently used, looking at the areas where the assurance level was not good enough. In doing this, they took account of the importance of each of the transmission system’s functions.
(2) Analyze the correlation between assurance levels and defects
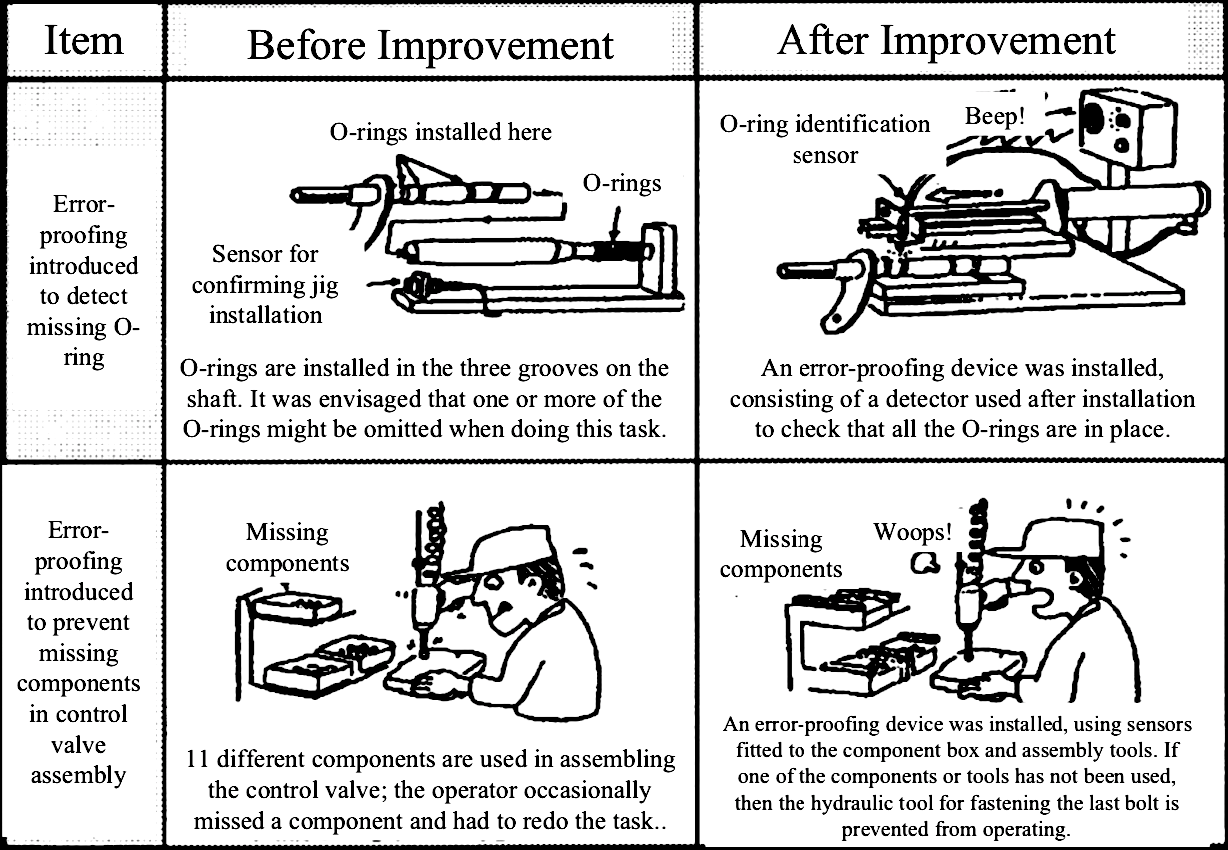
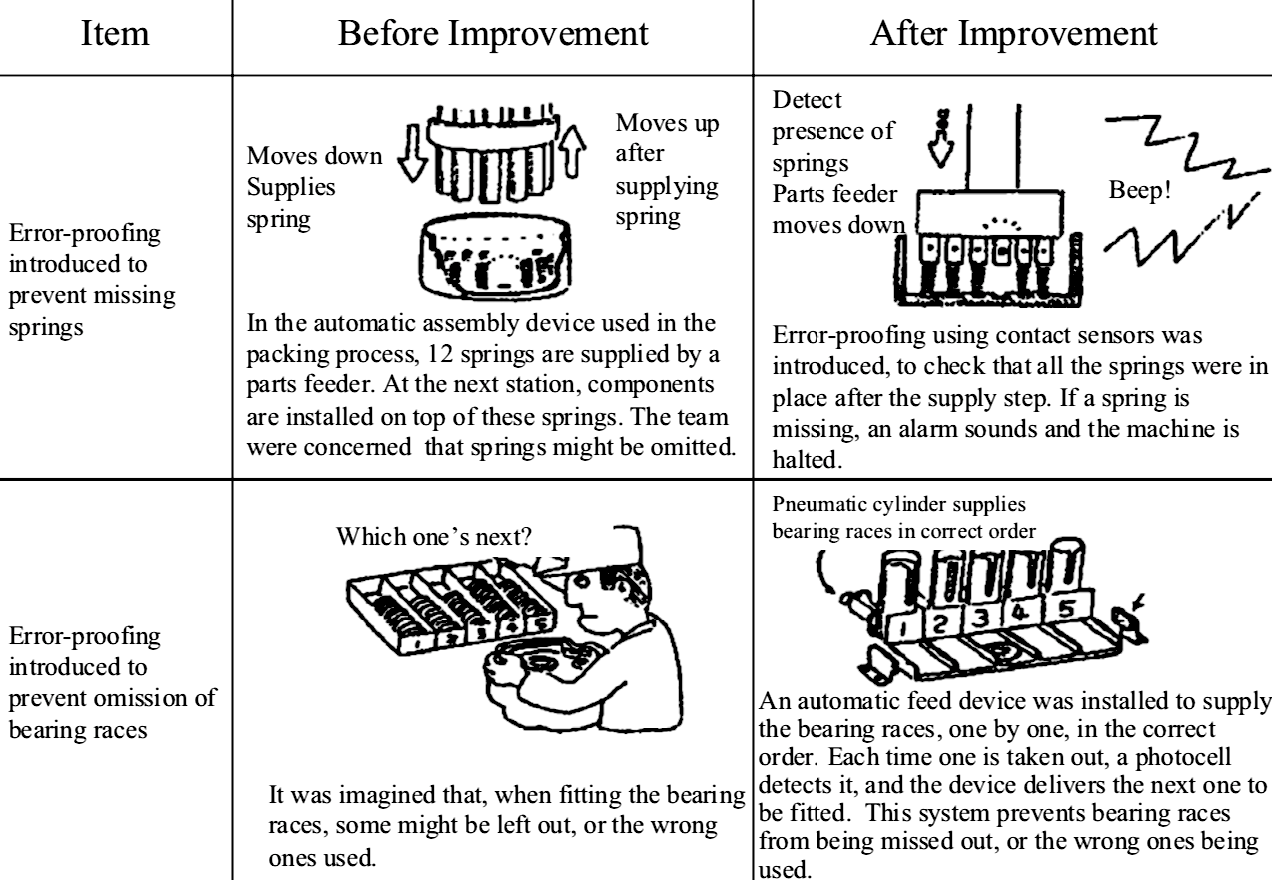
By studying the likelihood of a defect occurring in each of the work procedures, and the assurance level for each work operation, the team was able to identify the precise mechanisms behind defects. In practical terms, they worked with the operators to investigate the situations in which defects arose and then analyze the differences between the standard work procedures and the work carried out. This allowed them to discover precisely why conditions were not being observed. (See Figure “Improving operator-dependent Assurance Modes” below).
Step 4 Eradicate Causes
(1) Propose and implement improvements
Having established the potential defects and the mechanisms behind them, the company then devised improvement proposals to nip these in the bud. With help from technical staff and maintenance personnel, twenty improvements were implemented on the line. The key aim was to find improvements that would minimize the number of operations relying on workers’ judgment and powers of concentration and make it impossible to carry out their work other than in the traditional manner. Figure “Improving operator-dependent Assurance Modes” (1) and (2) illustrate specific examples of some of these improvements.
(2) Check results
These improvements helped raise the quality assurance rate for the assembly process to 95.3%, meaning fewer potential defects were passed on to later functions (see Figure “Confirmation of Results”). The system was effective – by identifying possible defects and nipping them in the bud, the company was able to improve the QA rate of the process.
Step 5 Establish Conditions
(1) Revise Quality Assurance Rate Evaluation Table
The QA Rate Evaluation Table was revised each time the team completed a particular improvement.
(2) Revise standards
Making improvements meant changing the operational benchmarks, and therefore the team revised all of the task guidelines and other work standards appropriately. These changes affected, for example, the order in which components were assembled, the way pieces were arranged, and the way jigs and tools were used.
Step 6 Maintain Conditions
The company wanted to make sure that the new situation was faithfully sustained after the accreditation for excellence had been achieved, so they instituted a system of daily checks to ensure that the employees were maintaining the equipment and work area in the proper condition and organizing and observing the job site control forms and standards properly. They also wanted to confirm that the work standards were established and obeyed. If any defects occurred, they would be dealt with painstakingly and reliably prevented from happening again.
Step 7 Improve Conditions
Factors such as the arrangement of the components, the difficulties of using a particular jig or tool, or the inclusion of strenuous operations that require twisting or stretching may not directly cause defects, but they can be a contributing factor.
Therefore, after restoring the situation in Step 2, Company B sought to improve complex tasks to make them easier to carry out correctly. In conjunction with this, they instituted tagging and de-tagging of such tasks as part of their Autonomous Maintenance program.


4M Analysis Process: Root Cause Guide for Manufacturing
Learn how to use 4M Analysis to find manufacturing root causes across People, Machine, Method, and Material with diagrams, examples, and checklist.


