(6) Control Charts
A control chart is a line graph on which control limit lines are plotted in order to find out if a process is in a stable condition, or in order to keep it so. Control charts can be used for attributes (discrete data that, by its nature, can only be expressed as positive integers, such as numbers of people and incidences of failure), or for variables (continuous data such as length, weight, time or temperature).
1 X̄ − R Control Chart
An X̄ − R control chart is an X̄ control chart combined with an R control chart.
An X̄ control chart is mainly used to portray changes in the mean of a distribution, while an R control chart is used to portray changes in the distribution range or within-subgroup variation. An X̄ − R control chart is used when the process characteristic is a variable such as a length, weight, strength, purity, time or production volume.
2 p Control Chart
A p control chart is also known as a “fraction defective” control chart – the “fraction
defective” p is the fraction of defective products within a sample – and is used on its own rather than in combination as in an X̄ − R control chart.
A p control chart is classed as a control chart for attributes and is used when the sample size n is not fixed (if, for example, 100 steel plates were received in one day, and 8 were defective, and 200 steel plates were received over 5 days, and 14 were defective).
3 np Control Chart
An np control chart is also known as a “number defective” control chart – the “number defective” np being the number of defective products within a sample. It is classed as a control chart for attributes and is used when the sample size n is fixed.
4 Control Limit lines
Any graphical representation without control lines is simply a graph, rather than a control chart.
A control chart has a central line (CL), an upper control limit (UCL) and a lower control limit (LCL), collectively known as control lines (see Figure “A Control Chart With Control Limit Lines”).
A 3σ control chart defines a range of 3σ above and below the central line, which represents the mean, and the upper and lower limits of this range become the control limit lines.


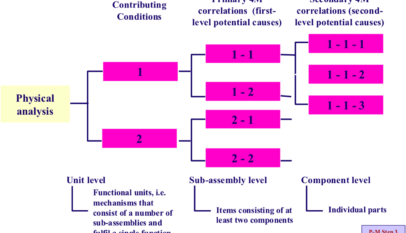

4M Analysis Process
The purpose of this procedure is to define the steps to do a 4M …


Very good