3-11-3 Planned Maintenance Activity
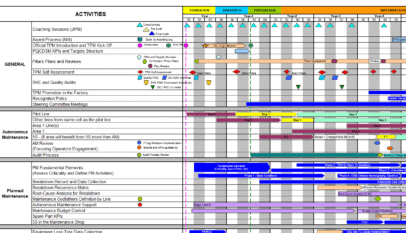
The main difference between Autonomous Maintenance and Planned Maintenance lies in whether or not special skills are required. Autonomous Maintenance is done on a daily basis, whereas Planned Maintenance seeks to build a system in which environmental or situational changes do not initiate new problems. In TPM-MAKE, these two types of maintenance are often compared to wheels on a car: they work together, and both play an important role.
The key points in Planned Maintenance are:
- Gain a clear understanding of the difference between the desired (“to be”) state and the current (“as is”) situation, in order to achieve the former.
- Build a system that maintains regular surveillance and control of the weaknesses overcome by Autonomous Maintenance and Individual Improvements.
Throughout the Supply Chain, the target of Planned Maintenance is the “system”. It is, in practice, “system maintenance”. The individual steps are:
Step 1: Identify and Analyze Weaknesses
Carry out an inventory of the operation and search for all current defects. Then analyse their causes and categorize them.
Step 2: Execute Improvements
Improve the defects and overcome the weaknesses in the operation to prevent their recurrence. Decide the desired (“to be”) state of operation, draft an improvement plan and execute improvements.
Step 3: Build A System for Maintenance and Control
Reinforce the information management structure and build a system to maintain and control the new (i.e. improved) situation.
Step 4: Build A Structure for Regular Maintenance
Finally, provide training to the person in charge, enabling him/her to gain the special skills required for maintenance. Draft a maintenance calendar and start building a system for conducting regular maintenance activities.
3-11-4 Education and Training
Education and training are vital, and provide fundamental support for TPM activities. As well as learning the concepts of TPM and “loss”, employees must also be taught the necessary skills for each job.
The skills needed in the supply chain differ fundamentally from the techniques of production and maintenance used in Make. However, most Supply Chain functions have never compiled a detailed analysis of the skills needed in their daily operations. It is therefore recommended that companies start by identifying those skills, in the following way:
- Carry out an inventory of the operation, using interviews and work analyses as in Industrial Engineering or Activity based Costing,
- Identify and list specific elements of the work,
- Categorize the work elements,
- Identify the necessary skills/knowledge for each category.
The kinds of skill required in the supply chain cover a very wide area, and must be individually identified by association with the type of work in which they are needed — purchasing, demand planning, supply planning, production planning, delivery planning, and so on. All the skills applicable to those areas should be sorted out and listed in a “Skills Matrix” (as in TPM- MAKE). The “Skills Matrix” can then be used to identify the current strengths and weaknesses of each employee, to plan his/her training program, and to monitor progress.
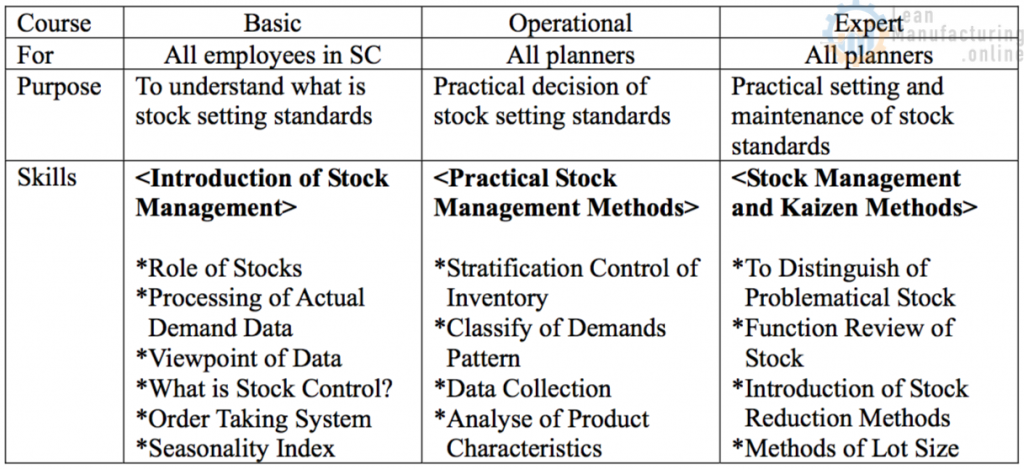
By understanding the gap of skills between ideal and current situation, the necessary training will be prepared for all relevant employees. An idea of training for planners is shown in Chart-19.
Chart 19 Education and Training (Example of Stock Management Skill Development)
3-12 Achieving the Goal
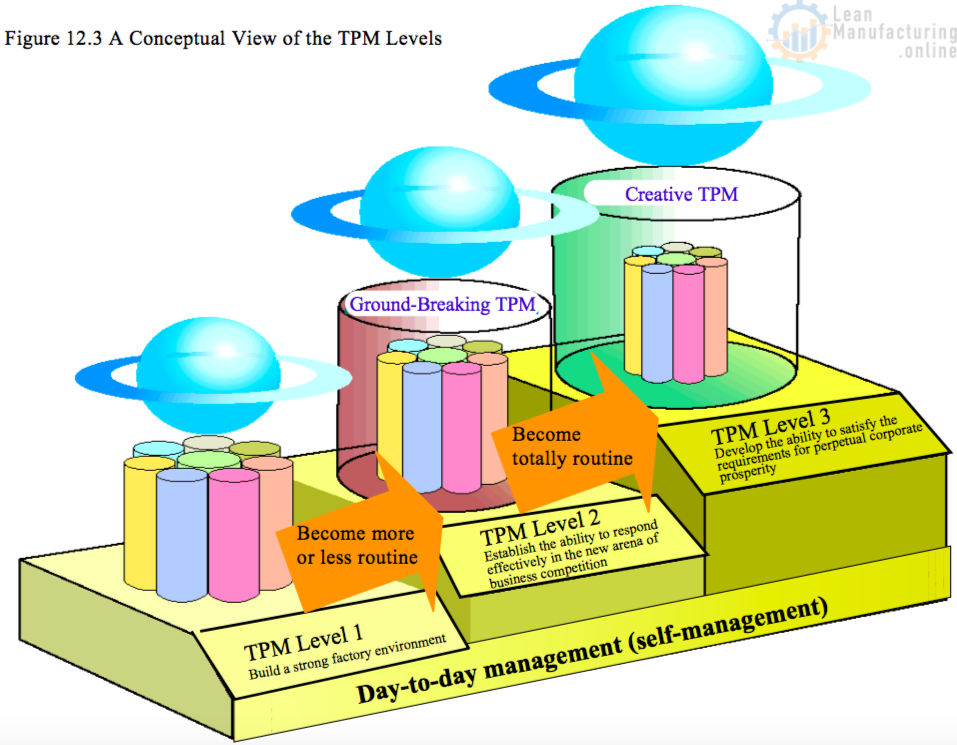
The progress regularly has to be reviewed by the steering committee, the function and each team. Once all the targets have been achieved, higher targets would be set for further improvement sometimes, and it would be the time to challenge the next level of activity. Before that, the TPM Special Award will be the good hurdle for next challenge.
3-13 Challenging the TPM Special Award
As explained former section, challenging TPM Special Award is a good opportunity to ensure the level of activity as the final stage of TPM Level II. Here it is necessary to show the high degree of contribution of TPM activities to the business in terms of both tangible and intangible benefits. The activity board will help to show overall (historical) success story of the activities during the JIPM assessment. Before final assessment, the activity report following JIPM format will be prepared and submitted. The report will be evaluated and the special assessment will be carried out by JIPM in advance. If it is satisfactory, then the final assessment will be carried out. For application, please contact JIPM in Tokyo, Japan.
3-14 Keys to Success
Especially the top management diagnosis, activity board, KPIs/PIs and TPM manager’s skill are listed as key factors to success in TPM implementation.
Top Management Commitment
The top management commitment is extremely important to lead and enhance the activities. The diagnosis by top management should be conducted regularly in order to check the approach, progress and also issues to be solved. If necessary, the top management must help each team to solve these issues. So that all the team members can have confidence. The diagnosis will be carried out according to the presentation by each team by using the activity board.
Activity Board
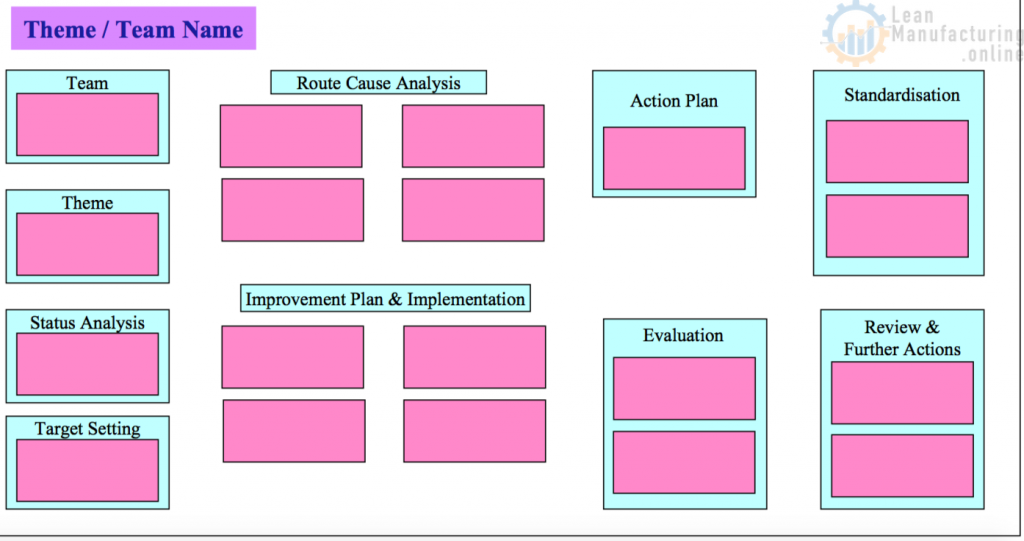
The activity board is one of key tools for success of TPM. Its effect called “Visual Management” enables people from top management to employees to communicate the overall scenario here at a glance.
In terms of purposes, there are several types of activity board to indicate the overall activity scenario and the details. One is overall TPM activity board which is managed by TPM office. Others are main activity board for each function or team and detailed activity board for each theme. The latter boards are explained below as the example.
The following “QC Story” is used in the detailed activity board especially for Focused Improvement. It summarizes how to conduct improvement activities effectively.
- Set theme,
- Understand current status,
- Make activity plan,
- Analyse route cause,
- Create possible countermeasures,
- Execute counter-measures,
- Confirm effects,
- Standardize,
- Review results and further actions,
- Future plan.
The Chart-20 and 21 show image of Focused Improvement activity boards used in pilot program as example.
Chart 21 Activity Board – FI Main Board
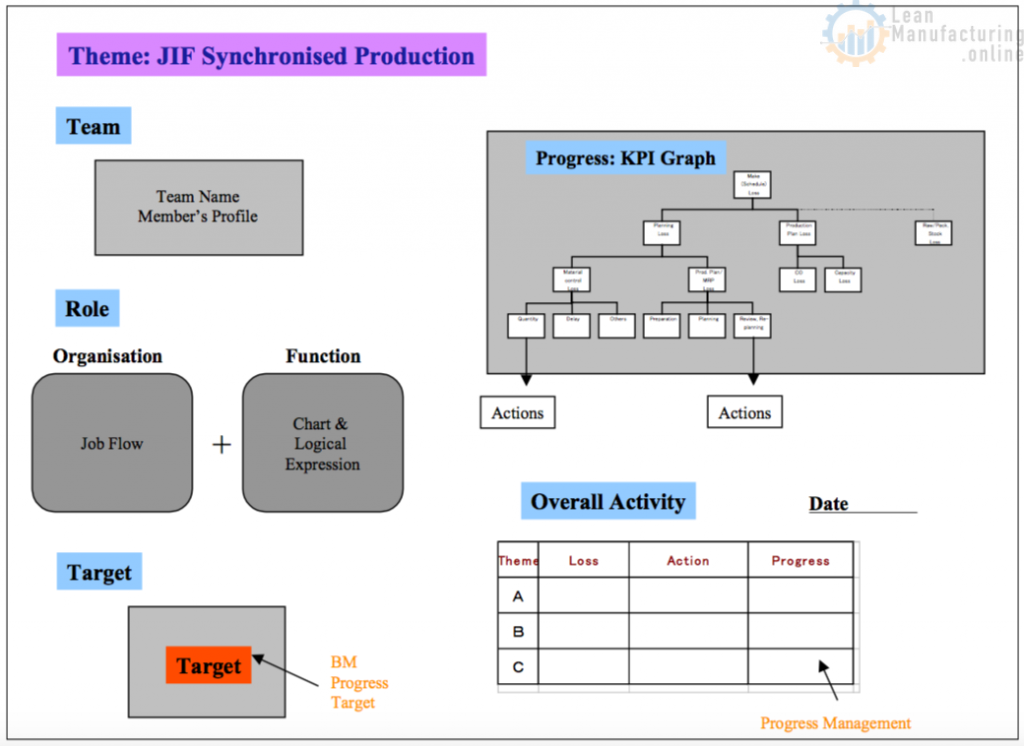
Chart 22 Activity Board – FI Individual Board
KPIs/PIs
KPIs (Key Performance Indicators) and PIs (Performance Indicators) will also be key factors to interpret the activity progress. These have to be defined and agreed to use within the company or at least the supply chain operating unit. Some of these are common indicators (KPIs) for business operation and others are specific indicators (PIs) for specific tasks. In specific indicators, sometimes losses are use as the indicators.
The tree of KPIs/PIs graphs will be used in the main activity board in order to show the progress. This is one of the way of “Visual Management”. Refer to the Chart-21.
Role of TPM Manager
The TPM manager (leader of TPM office) is required to carry out the following tasks:
- (1) Build a basic plan (i.e. 3 years).
- (2) Build an execution plan (annual plan, budget, etc.).
- (3) Conduct promotion office functions (TPM Office) such as making proposals to the TPM Steering Committee (discussions of company-wide promotion policy).
- (4) Liaise between the CEO and the employees (report at management meet, weekly operation meet) .
- (5) Ensure accurate awareness of promotion progress, and promotion of TPM (TPM promotion communication meetings).
- (6) Support administration of section group meetings and circle activities.
- (7) Organize and lecture at TPM training program (study groups by work field, management of training locations).
- (8) Organize and manage consultant seminars.
- (9) Plan and manage events.
- (10) Keep records of activities, and summarize their results.
- (11) Make internal PR of TPM news (company newsletter, bulletin boards, etc).
- (12) Prepare for the TPM Awards (make reference, organize rehearsals).
- (13) Coordinate external relationships (observation tours by other companies, or going on an observation tour of another company.).
Therefor TPM manager’s skill and ability will be one of key factors of success in TPM. The skills will be required in terms of supply chain operation as well as TPM. However in current operation of TPM is focused on Make area. It is, therefore, recommended that TPM-SCM Office consists of mixed members from TPM-MAKE Office and supply chain functions.
4. TPM-SCM Pilot Case
The activities of the pilot program in Plan- Source-Make-Deliver and several templates of loss tree area are summarized as follows:
4-1 Practices in TPM-SCM Pilot Program
Key activities in pilot program are “Autonomous Maintenance in Order Taking Center”, “Demand Forecasting”, “Stock Management” and “JIF Synchronized Production” as Focused Improvement.
4-1-1 Autonomous Maintenance in Order Taking Center
1) Objective
The objective of this activity is to improve customer service, efficiency of order taking job and skills of members.
2) Themes and Actions
This activity is based on the Indirect Autonomous Maintenance steps. At each step the top management diagnosis has been set according to the diagnosis sheet.
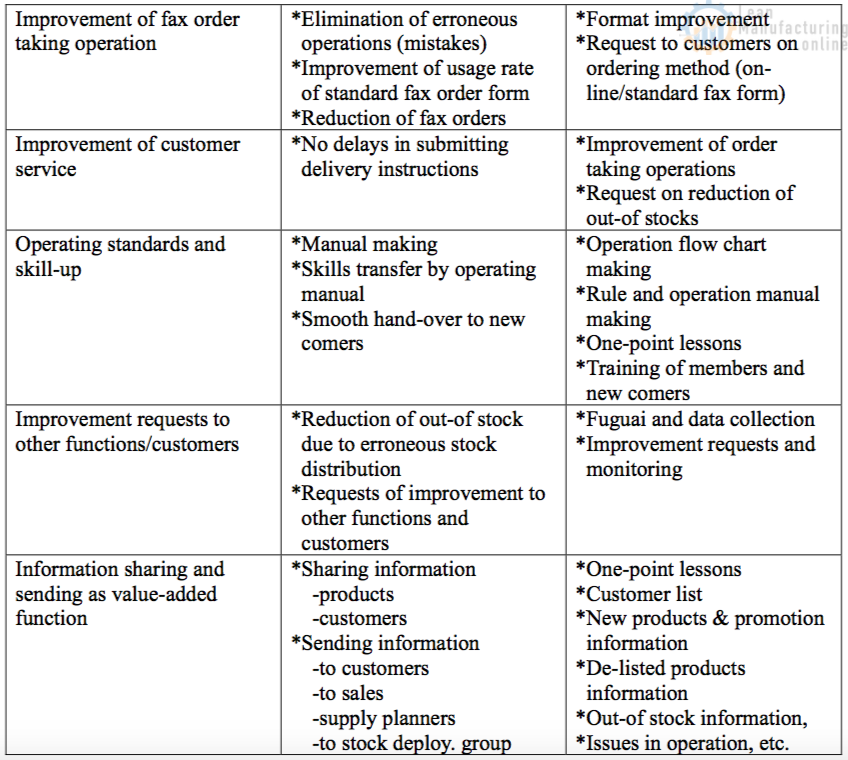
Themes and detailed actions taken in this activity are shown in the following Chart-22.
Chart 22 Autonomous Improvement in OTC

3) KPIs/PIs
Examples of KPIs and PIs used in this activity are shown below:
- Number of suggestions
- Number of improvements
- Number of improvement requests
- Number/ratio of completed improvement requests
- Number of one-point lessons
- Number of mistakes in order taking
- Number of “stock out” due to erroneous stock distribution (Stock Deployment group PI)
- Number of delays in submitting delivery instructions (by 12:00)
- Ratio of on-line order taking
4-1-2 Demand Forecasting
1) Objective
The objective of this activity is to establish the demand forecasting methodology and to improve demand planner’s skills and forecast accuracy.
2) Themes and Actions
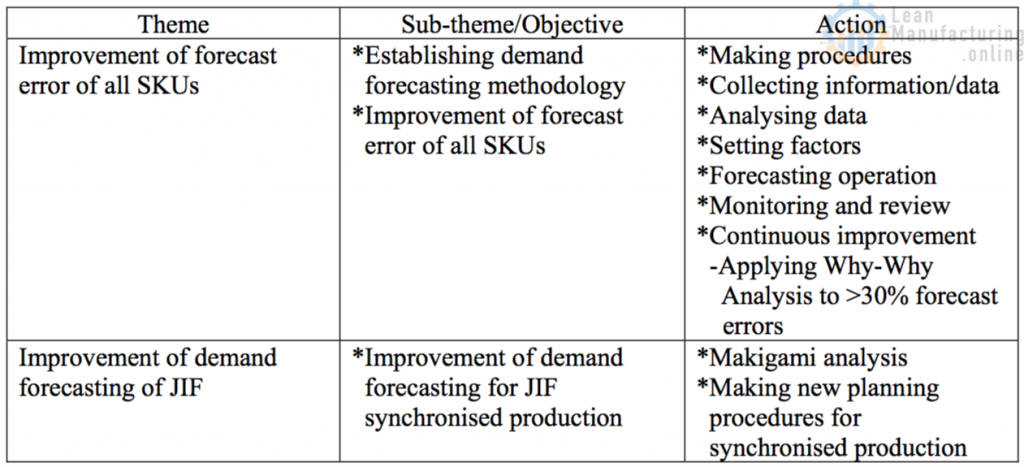
This activity has been started with the status analysis on past forecast error data, and factors then prioritized. The focus in this pilot program is mainly on the volume trend and seasonal effect for all SKUs. The forecast errors have been improved by applying the developed procedure and detailed analysis i.e. Why- Why Analysis in case of over 30% errors. Further tasks will be the effect analysis by cause element such as cannibalization by promotion and sales support, TV advertisement, NSV change and competitor’s activity, etc. These will help forecasting skill improvement.
The themes and detailed actions taken in this activity are shown in the following Chart-23.

3) KPIs/PIs
Example of KPI used in this activity are shown below: – Forecast error of each SKU (%)
4-1-3 Stock Management
1) Objective
The objective of this activity is to reduce stocks, to improve case fill and supply planner’s skills.
2) Themes and Actions
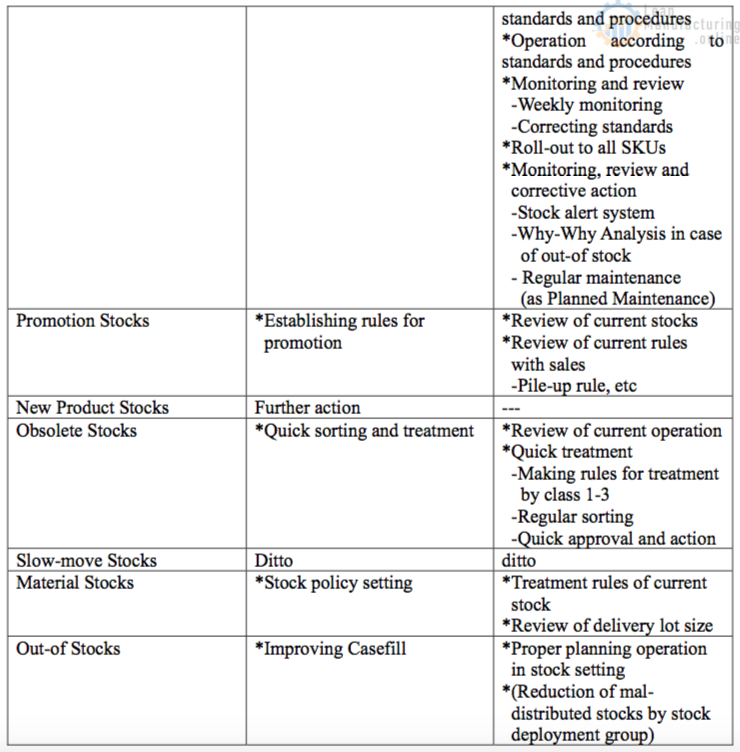
This activity has been started with the status analysis on past stock/case fill data as loss identification according to the loss (stock) category. The focus in this pilot program is mainly on on-going stocks and obsolete stocks. These stocks have been reduced through improvement in terms of setting standards, monitoring and making procedures/rules with detailed analysis i.e. Why-Why Analysis in case of out-of stocks. Further tasks will be on promotions, new products and materials etc.
The themes and detailed actions taken in this activity are shown in the following Chart-24.
Chart 24 FI – Stock Management

3) KPIs/PIs
Examples of KPIs used in this activity are shown below:
- On-going stock value (i.e. %NPS)
- Promotion stock value
- New product stocks
- Obsolete stock value
- Slow-move stock value
- Material stock value
- Case fill (%)
4-1-4 JIF Synchronized Production
1) Objective
The objective of this activity is to reduce stocks, lead-time and supply chain cost by enabling the synchronized production as a model activity for process and function loss improvement.
2) Themes and Actions
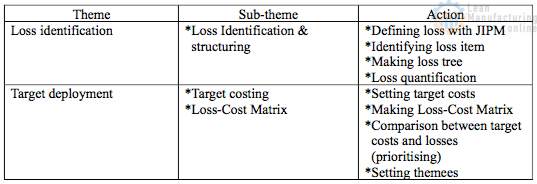
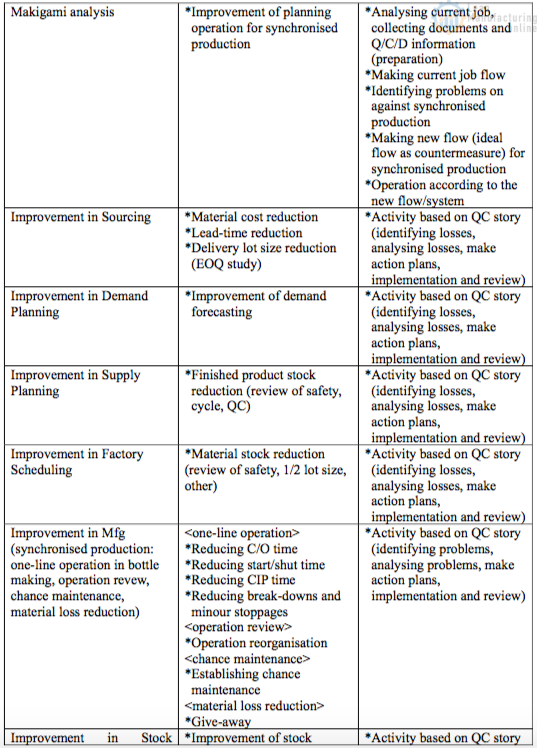
As a method to reduce lead-time, stocks and supply chain cost, the synchronized production has been applied to the supply chain process of a product line JIF. In this activity, target costing and Makigami Analysis have been introduced. The former one is a method of target deployment. And the latter one is to improve planning operation and its lead-time.
Themes and detailed actions taken in this activity are shown in the following Chart-25.
Chart 25 FI – JIF Synchronized Production

3) KPIs/PIs
Examples of KPIs or PIs used in this activity are shown below:
Related to Cost
- (NPS)
- Supply chain cost (product cost + supply cost)
- Product cost (material cost + factory direct cost + factory indirect cost, etc.)
- Supply cost (buying & planning + distribution, etc.)
- OEE (%)
- PE (%)
- Give-away cost
- Storage cost
Related to Capital
- (GCE)
- Fixed assets
- Working capital (stock, debtor, creditor)
- Finished product stocks (%NPS, value or tonnes)
- Semi-finished product stocks
- Material (raw material & package) stocks
- Cash flow
- Financing charge
- JIT rate of material procurement (delivery lead-time within 1 week), etc.
4-2 Loss Tree Templates
Down below you can find several templates of loss tree, such as stock loss (Chart-26), out-of stock loss (Chart-27), demand planning loss (Chart-28), supply planning loss (Chart-29), make planning (factory scheduling) loss (Chart-30), stock deployment planning loss (Chart-31), sourcing loss (Chart-32) and Make loss (Chart-33). The template of each loss tree has been used for Focused Improvement activity during the pilot program.
Chart-26 Stock Loss Tree

Chart 27 Out of Stock Loss Tree

Chart 28 Demand Planning Loss Tree

Chart 29 Supply Planning Loss Tree

Chart 30 Make Planning (Factory Scheduling) Loss Tree
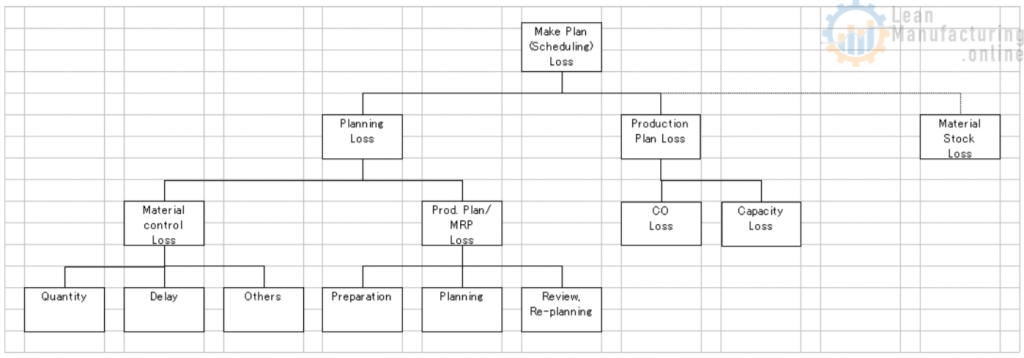
Chart 31 Stock Deployment Planning Loss Tree

Chart 32 Sourcing Loss Tree
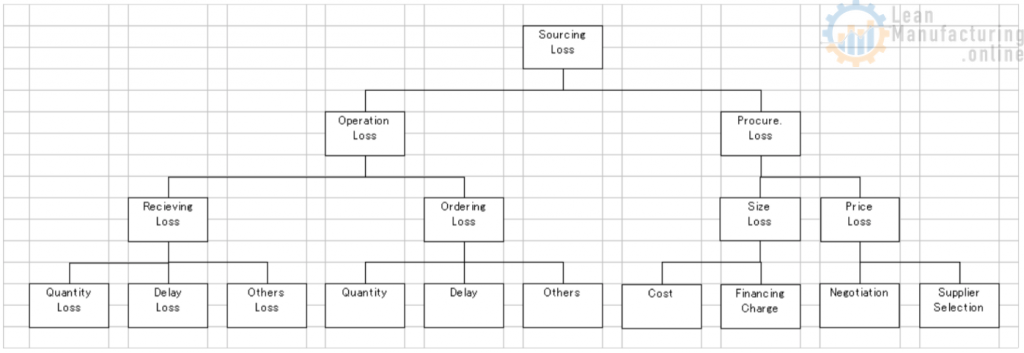
Chart 33 “MAKE” (Factory) Loss Tree


