There are many different schemes for graphic representation of QFD, including triangular and rectangular layouts, which outside of Japan are sometimes called house block drawings. Diagrams in which a rectangular section is crowned with a triangular one are said to resemble a house and are sometimes referred to as a house of quality.
We will go into more detail in the next section, but when schematic diagrams are used to represent deployment tables, summaries are usually shown as triangles and two-dimensional matrices are shown as rectangles. Although matrices are often used to represent the interaction of two deployment tables in the achievement of an objective, the creation of matrices themselves is not the objective of quality deployment. It is necessary to determine beforehand which deployment tables are necessary and which need to be combined into matrices. There are some people who create matrix after matrix in a QFD technique that creates “matrices of matrices” but the creation of matrices themselves is, in fact, meaningless.
The first thing that needs to be determined in the implementation of QFD is the overall layout of the conceptual diagram. It is important to verify the objective of implementing QFD, and then create a conceptual diagram that matches that objective. Starting QFD without first creating a conceptual diagram is a little bit like setting out to sea in a rowboat, and is more likely than not to result in a sailor deciding to return to port before he is even halfway to his destination.
The number and type of deployment tables you create will depend entirely upon the objective of the QFD implementation. It would be a mistake to think that just because you created a required quality deployment table and a quality characteristic deployment table that you had achieved quality deployment. The clearer and more specific your objectives are, the easier it will be to determine what tools are necessary to achieve that objective. If you want to drive nails, you need a hammer, and if you want to cut lumber, you need a saw. Not knowing what tools are available makes it impossible to prepare, but just gathering every tool insight without understanding what it is you are trying to do is putting the cart before the horse.
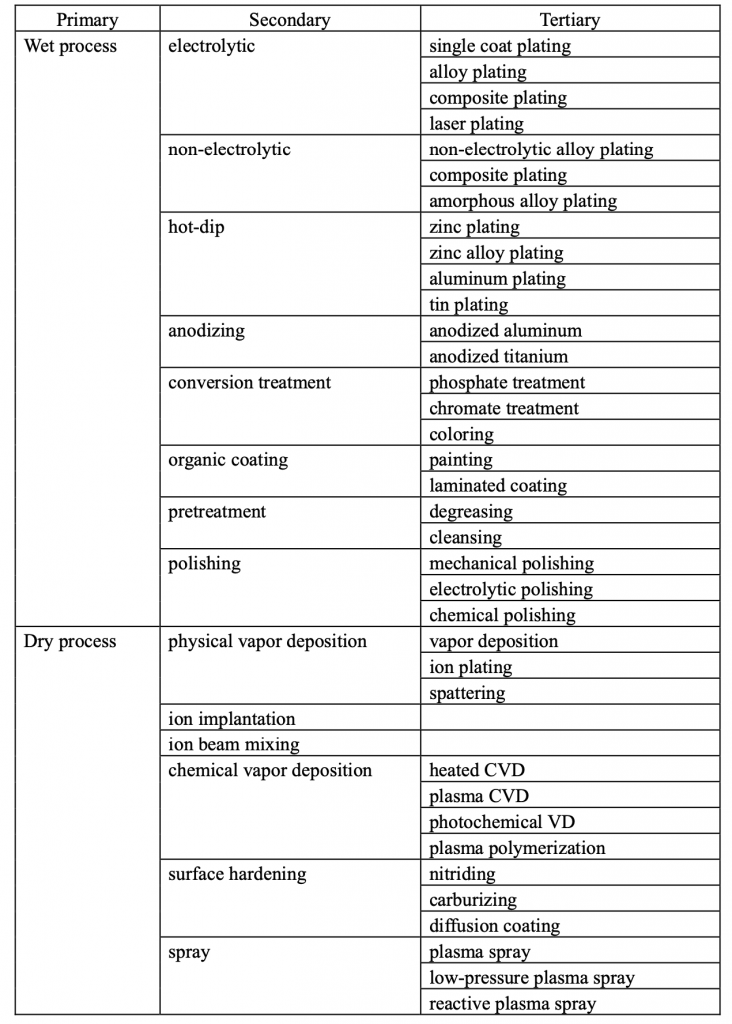
Of the tables I have used in past QFD implementations, the most useful ones have been required quality deployment tables, quality element (characteristic) deployment tables, planning quality settings tables, design quality settings tables, function deployment tables, mechanism deployment tables, unit and part deployment tables, construction method deployment tables (See Table below), new product deployment tables, cost deployment tables, planning ex-factory cost settings tables, materials deployment tables, FT deployment table, planning reliability settings tables, meter deployment tables, measurement deployment tables, business function deployment tables, technology deployment tables, QA tables, QC process tables, and warranty item deployment tables.
QFD emphasizes the importance of understanding the requirements of the market. To this end, we recommend starting with the creation of a required quality deployment table. There is no need, however, for QFD to always start from required quality deployment tables. There are even times when it is not possible to do so.
There are many conceivable objectives for implementing QFD, such as effective quality assurance, rapid development of a new product, or the establishment of a quality assurance system. In cases where it is necessary to understand the customer’s needs, a required quality deployment table becomes a necessity, and if the customer presents his requirements in the form of drawings and specifications sheets, deployment of the function of these materials is often an effective manner in which to proceed.
If the objective is to reduce ex-factory costs, it will be necessary to start with a cost configuration study, which means the creation of a cost deployment table. If the objective is to improve the efficiency of business operations, then the creation of a business function deployment table is called for. Thus, it is important to learn to match the tools you choose to the job at hand.
Matrices are used to understand cause-and-effect relationships, to discover early on where bottlenecks are, and to prevent omissions. A matrix comprising a required quality deployment table and a quality characteristic deployment table can be used to determine which quality characteristic is the most crucial to meeting market needs, and can also be used to determine whether or not there have been any omissions in the characteristics that have been earmarked as indicators of how well the market needs have been met. A study is made of the deployment tables necessary to achieve the intended objective, and these tables are then displayed in a triangular schematic. A study is then made to determine which factors will be deployed against which in a matrix, which is a rectangular schematic. Next, a study is made to determine which matrix the results of the first matrix will be deployed against, and a second matrix is created. Using triangular and rectangular schematic diagrams to illustrate the flow of this series of activities will result in the completion of the conceptual diagram. The diagram below is an example of a conceptual diagram for a typical quality deployment.
After the creation of a conceptual diagram, it is also necessary to give some thought to how the diagrams will be used once they are finalized. This is because the full value of these tools cannot be realized without a clear idea of how to use each of them. It is also necessary to understand how to maintain these tools according to the conditions under which they are used because no company has the time to create these tools just because they look like they might be useful.

- (1) Understanding user needs
- (2) Transform primitive data into requirements
- (3) Transform requirements into required quality
- (4) Create required quality deployment table
- (5) Create quality element deployment table
- (6) Create a quality table
- (7) Establish planning quality
- (8) Transform required quality criticality into quality element criticality
- (9) Establish design quality


4M Analysis Process: Root Cause Guide for Manufacturing
Learn how to use 4M Analysis to find manufacturing root causes across People, Machine, Method, and Material with diagrams, examples, and checklist.


