Manufacturing doesn’t need more “initiatives.” It needs a repeatable way to turn everyday friction into measurable gains, without burying teams in paperwork or relying on heroics to keep results alive.
That’s where RIVET comes in.
RIVET is a five-step continuous improvement cycle designed for real shop-floor conditions: competing priorities, shifting schedules, mixed product flow, imperfect data, and the reality that a fix isn’t a fix unless it holds.
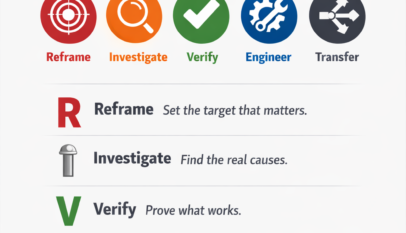
RIVET stands for: Reframe, Investigate, Verify, Engineer, Transfer.
The name is intentional. A rivet permanently joins materials. This method permanently joins people, process, and proof, so improvements don’t loosen over time.
Why most improvements fade
If you’ve run enough improvement events or problem-solving efforts, you’ve seen the same failure patterns:
- The “problem” is vague, so the team solves the wrong thing.
- The team jumps to solutions before understanding how the process actually behaves.
- Root causes are guessed, not proven.
- A countermeasure works on a good day, then collapses on a bad day.
- Sustainment is treated like a reminder instead of being built into the system.
RIVET eliminates those traps with one big shift: proof and permanence are not optional. They’re built into the cycle.
The RIVET mindset
Before diving into the steps, keep three mental rules:
- Clarity beats complexity. If the team can’t explain it simply, the system won’t run it consistently.
- Observation beats debate. The process will tell you the truth faster than a meeting room.
- Proof beats preference. The best fix is the one that moves the metric and survives real conditions.
Now let’s walk through each phase with practical actions, useful tools, and what “done” looks like.
1) Reframe: Set the target that matters
Most improvement work goes wrong at the start. The team says, “We have too much scrap” or “Downtime is killing us,” and then immediately starts proposing solutions. Reframe forces discipline. It turns a complaint into a focused target and a measurable finish line.
What to do
Start with a plain-language friction statement. Keep it short and specific:
- What is happening?
- Where is it happening?
- When is it happening?
- Why does it matter?
Example: “On Line 3, we are losing 40–60 minutes per shift to unplanned stops on the capper, causing missed shipments and overtime.”
Then set a target condition: a measurable outcome, a deadline, and a clear scope boundary (where it starts and stops).
Example: “Reduce unplanned capper stops on Line 3 from 6 per shift to 2 per shift by March 31, while maintaining quality.”
Finally, align on one primary metric and no more than two supporting metrics:
- Primary metric: the outcome (scrap %, downtime minutes, on-time delivery)
- Supporting metrics: the levers (cycle time, changeover time, first-pass yield)
Tools that help
- Pareto chart to pick the biggest loss
- Simple scope map (start/stop boundaries)
- CTQ thinking to tie the problem to the customer or next-process needs
What “done” looks like
Everyone can answer: What are we improving? How will we measure it? Where will we focus? By when? If those answers aren’t crisp, the team is about to waste effort.
2) Investigate: Find the real causes
Investigation is where you stop relying on assumptions and start learning from the work itself. This is not a desk exercise. It’s a “go see” step that captures the actual workflow, the actual variation, and the actual sources of loss.
What to do
Walk the process end-to-end. If possible, follow the product, not the org chart. Then capture three things:
- Where the loss shows up (defects, delays, stoppages, queues)
- How the work is really performed (not how the SOP describes it)
- How the loss varies (by shift, operator, machine, product, lot, setup type)
A useful output here is a one-page Process X-Ray: a simplified flow of the real steps, the hotspots where issues cluster, and notes on variation and “what changes when it breaks.”
Stratification is critical. Manufacturing problems are rarely uniform. Averages hide the truth. Variation reveals it.
Tools that help
- Gemba observations with a structured checklist
- Time study or work sampling
- Spaghetti diagram for motion and material travel
- OEE loss tree to classify availability, performance, and quality loss
- Basic data stratification (shift, machine, SKU family, material lot)
What “done” looks like
The team can point to the top two or three loss points and explain what happens, how often, under what conditions, and with what evidence. If the team can’t show it, they don’t know it yet.
3) Verify: Prove what works (and what doesn’t)
This is where RIVET separates itself from many improvement approaches. Most teams do some form of root-cause brainstorming and then “fix what seems right.” Sometimes they get lucky. Often they don’t. Even when they do, they can’t repeat it because the cause was never proven.
Verify requires proof-of-cause.
What to do
List the most likely drivers of your metric. Then prove or disprove them using the fastest credible method available. Proof doesn’t always mean advanced statistics. Proof means you can show the relationship between cause and effect well enough that a reasonable person would agree.
Practical proof options
- Compare conditions: when the issue happens vs. when it doesn’t
- Short trials: change one factor and see if the metric moves
- Simple analysis: scatterplots, run charts, box plots
- Stability and capability checks when variation is the core problem
Example: If you suspect capper stoppages are driven by inconsistent bottle height from a supplier lot, don’t argue about it. Stratify stoppages by lot, run a short controlled trial, and measure bottle height variation across lots.
Tools that help
- Cause-and-effect thinking (6M/8M) to avoid tunnel vision
- 5 Whys after evidence narrows the field
- Run charts and before/after comparisons
- Simple hypothesis thinking: “If X is true, then changing X should change Y”
- Lightweight DOE when needed (especially for chronic, multi-factor problems)
What “done” looks like
At least one driver is confirmed with a mechanism that the team can explain plainly. If you can’t explain the mechanism, you may be mistaking correlation for causation.
4) Engineer: Create robust solutions
A countermeasure that only works when the best operator is on shift is not a solution. It’s a temporary workaround. Engineering is about building a fix that survives reality: different operators, different shifts, different product mixes, equipment wear, supplier variability, and time pressure.
What to do
Design countermeasures that remove the cause or reliably control it. Then pressure-test the fix. Ask: What could break this? How will we detect drift early? What will we do when drift happens?
Then update the system around the fix: standard work, visual controls, training and qualification, preventive maintenance tasks, and a reaction plan.
Tools that help
- Poka-yoke (error proofing) to prevent defects
- Standard work and job instruction
- SMED if changeover is the pain point
- TPM actions if equipment health is driving loss
- Basic control plans for key process variables
What “done” looks like
The fix is documented in standard work, supported by controls, and validated across enough runs to prove it isn’t a one-off. “Works once” is a prototype. “Works repeatedly under normal conditions” is an improvement.
5) Transfer: Lock in and replicate
This is the step most organizations underinvest in, and it’s why the same problems keep coming back with new names. Transfer is about holding the gain in the original area and spreading the gain where it also applies.
What to do
Build a simple hold plan: 30/60/90-day checks (or the equivalent for your production cycle), layered audits or quick confirmation routines, ownership clarity, and a visual “control by design” element where possible (limits, triggers, interlocks, mistake-proofing).
Then replicate: identify similar lines, machines, cells, products, or shift patterns; document what must stay the same and what must adapt; roll the solution with a repeatable mini-playbook.
Tools that help
- Leader standard work (short, consistent checks)
- Layered process audits that verify critical steps
- Visual management in daily tier meetings
- SPC rules for critical characteristics (only where it truly fits)
- A one-page “what changed and why it works” summary
What “done” looks like
Performance holds without constant reminders, and the solution is reused rather than reinvented.
How to run RIVET quickly (without losing rigor)
RIVET-Quick (1–3 days)
Use when the issue is local and visible, data is available or easy to gather, and suspected causes are limited.
Focus on tight Reframe, fast Investigate, one proof test in Verify, simple Engineering updates (standard work plus a control), and basic Transfer (owner checks plus visuals).
RIVET-Deep (2–8 weeks)
Use when loss is chronic and multi-factor, variation is high, multiple departments are involved, or the impact is major.
Focus on stronger investigation and stratification, more rigorous verification, more robust engineering (controls, maintenance, training), and intentional replication.
A practical example you can copy
Let’s say your plant faces recurring rework in final assembly.
Reframe: Final assembly rework averages 14 hours/week on Product A, pushing shipments and consuming overtime. Target: reduce rework to 6 hours/week by March 31.
Investigate: Map the real assembly flow and identify rework hotspots. Stratify by defect type, station, shift, operator, and component lot.
Verify: Test the top suspected drivers (component lot effects, torque variation, post-changeover spikes) with simple comparisons and short trials.
Engineer: Update standard work, add a verification method, implement mistake-proofing where possible, and clarify the reaction plan.
Transfer: Lock in with quick layered checks and daily visual reporting, then replicate to similar products and lines where the mechanism matches.
In a month, this isn’t one project. It’s a system that learns.
What to put on the wall: the simplest RIVET rules
- Reframe: One metric. One target. One scope.
- Investigate: Go see the work. Stratify the loss.
- Verify: Prove the driver moves the result.
- Engineer: Build controls, not hopes.
- Transfer: Hold the gain and spread it.
When teams follow these rules, tools become optional. Results don’t.
Where to start with RIVET
Pick a problem where success is visible and meaningful: recurring downtime on one constraint machine, a top defect category driving scrap, long changeovers, chronic rework loops, or late shipments due to a bottleneck.
Run RIVET-Quick first. Build belief. Build momentum. Build habits.
RIVET was built for manufacturing, but it won’t stay there
Once your organization can run RIVET well on the shop floor, adapting it to other industries is straightforward: “Gemba” becomes where the work happens, OEE thinking becomes capacity and flow loss, standard work becomes standard workflow, and Transfer becomes playbooks and enablement.
The method stays the same because the logic stays the same: clarity, observation, proof, robust design, and sustainment by system.


4M Analysis Process
The purpose of this procedure is to define the steps to do a 4M …


